

Dow Jones outperformed other indexes on Monday reacting to the stimulus bill approaching the finish line of the legislation process. Take a look at our analysis.
In the second part of our post, we discuss GBPAUD – the most intriguing forex pair this week.
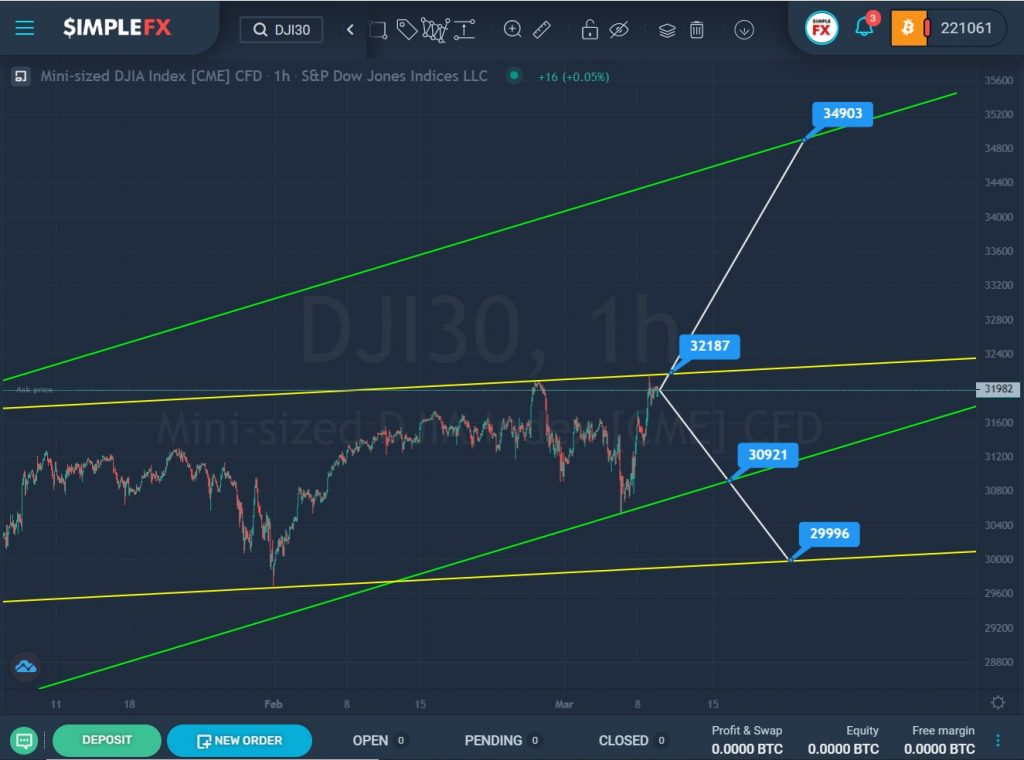
The DJI30 stock index forms a bullish trend in the long term, which moves inside the green channel. After the last rebound from the upper green line (this area is not visible on the chart), the market began to move in a horizontal direction inside the yellow channel.
Currently, the price is near the upper yellow line. Perhaps it will be able to break through this line and the resistance level of 32187. Then the bulls will have a clear path to the upper green wall and the resistance level of 34903.
However, the market can continue to build the horizontal structure of the index. In this case, market participants expect a price reduction. With a successful break of the lower line of the green channel and the support level of 30921, a path will be opened for bears to the lower line of the yellow channel and the support level of 29996.
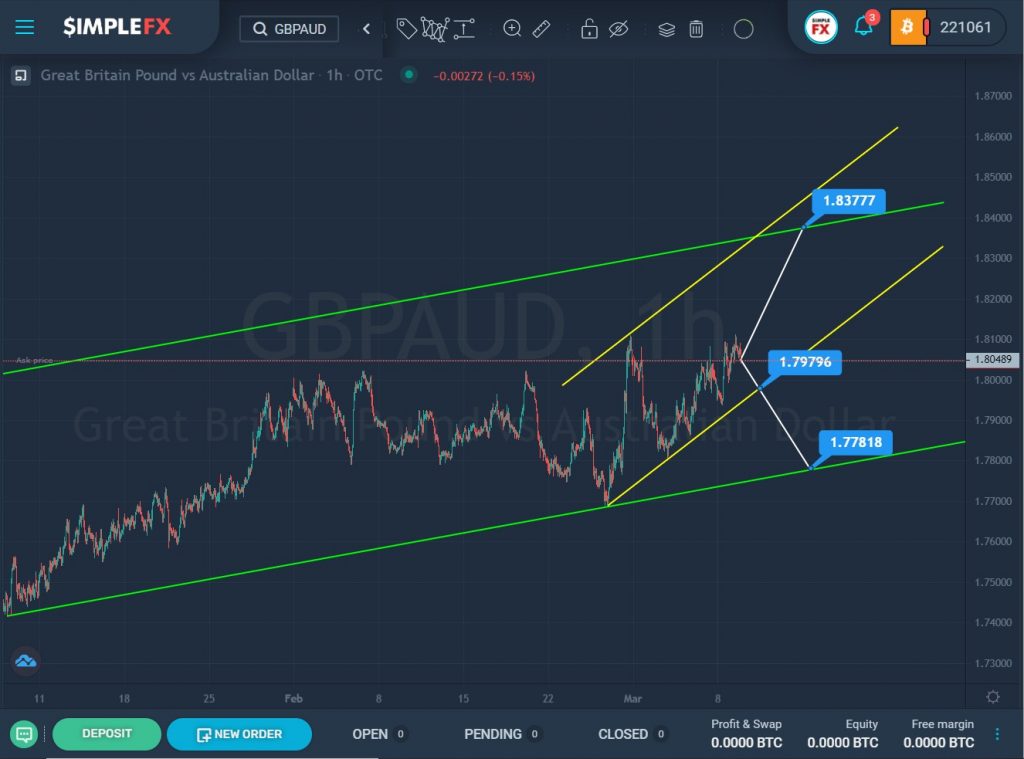
The current structure of the GBPAUD currency pair hints at the construction of an uptrend that moves within a large green channel.
On the 1H timeframe, we can see that the price moved smoothly from the lower green line in the direction of the upper line. But the bulls did not have enough strength to lead the market further. Reaching just above the middle of the channel, we saw a market reversal and a price drop.
Not so long ago, the market again pushed off from the lower green line and began to move in an upward direction along a small yellow channel. In the event that the lower yellow line is not broken, the bulls will have every chance to push the market to a new height – the resistance level of 1.837, which is on the upper green line.
However, if the price touches the lower yellow line and breaks the support level of 1.797, then we can expect a decline to the lower support level of 1.778, which is located on the lower green wall.