


How long will the bull’s market on tech stock last? Well, it can’t go on forever, although financial markets are sailing on uncharted waters for a long time. Take a look at our NDX100 analysis and make your decision.
We also find the EURGBP pair intriguing this week. Enjoy!

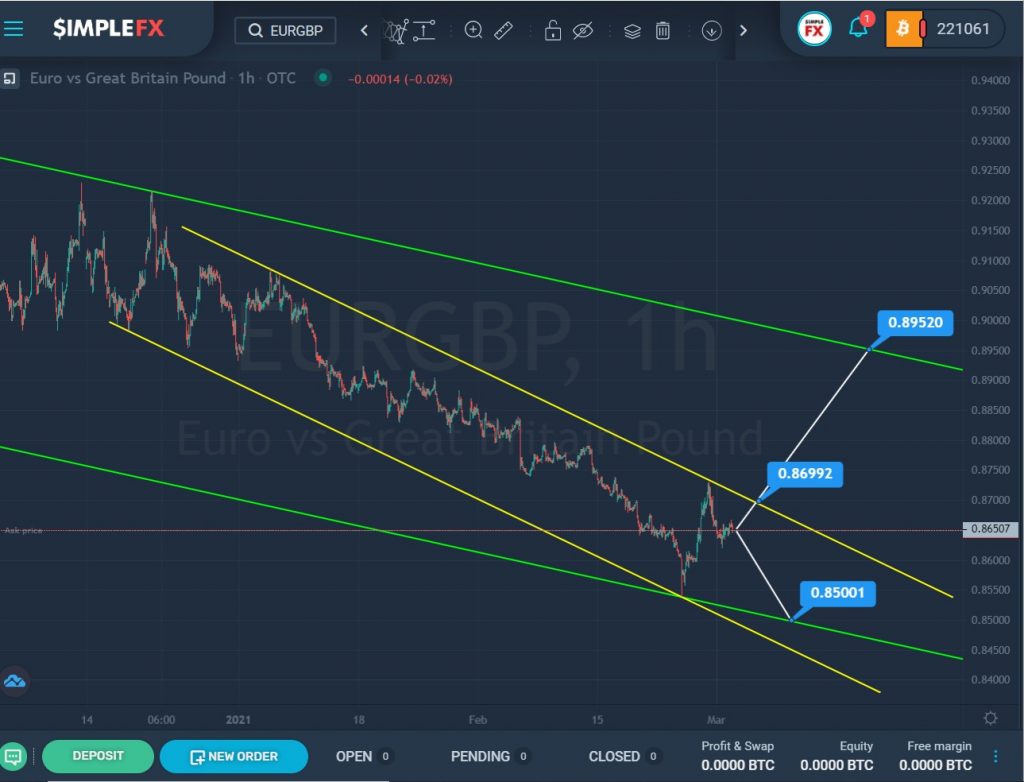
The current structure of the EURGBP currency pair hints at the construction of a global downtrend that moves inside the green channel.
Since the beginning of the new year 2021, the price has been gradually falling from the upper green line and recently it reached the lower green line. This section describes a small yellow descending channel.
After the last rebound from the lower green wall, the market began to move up. Perhaps the growth will continue in the next coming trading days. If the market reaches the resistance level of 0.869, which is on the upper line of the yellow channel, and breaks it, then the bulls will open the way to the next important level of 0.895, which is on the upper line of the green channel.
However, an alternative scenario is possible, in which we expect a repeated decline to the lower green line and the support level of 0.850.

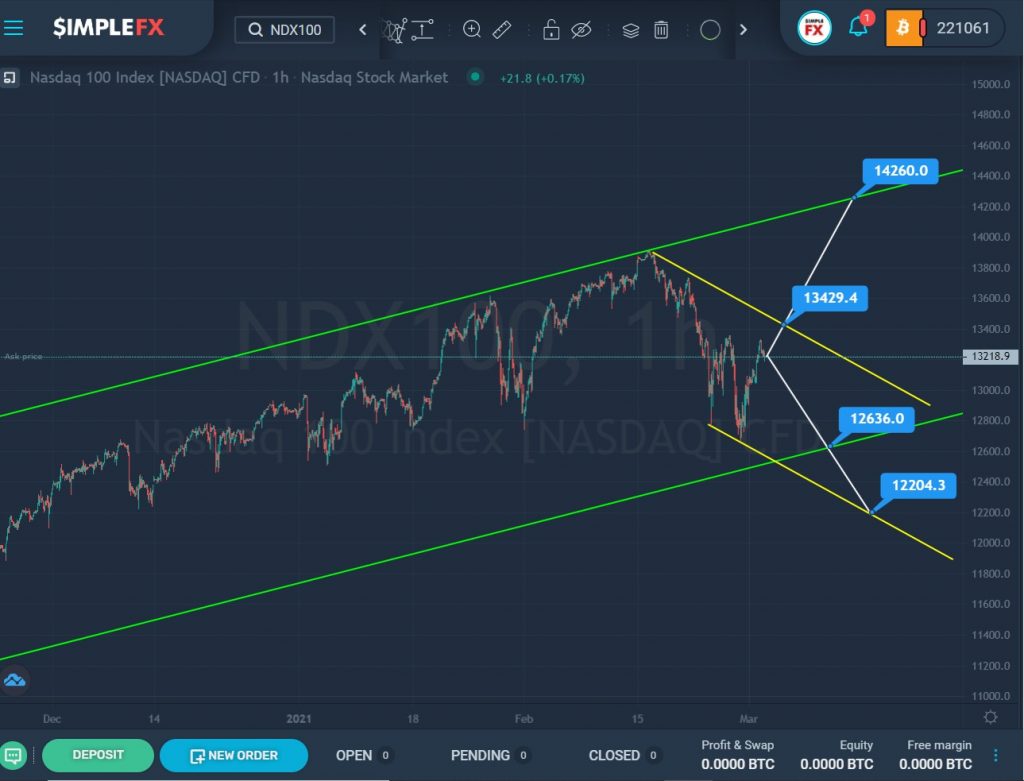
The NDX100 index hints at the construction of an uptrend that moves within the bullish green channel.
For a long time, the price was in the upper green zone. Not so long ago, it touched the green wall, but could not break through it, and began to decline sharply. Perhaps the market has started to form a new downtrend, which will form inside the yellow channel.
If the price continues to decline and reaches the support level of 12636.0, which is on the lower green wall, and then breaks through this level, then our assumption will be confirmed. The trend development will continue to the next support level of 12204.3, which is located on the lower line of the yellow channel.
It is possible that the bulls will try to take the initiative and lead the market. If the resistance level of 13429.4, which is located on the upper yellow line, is successfully broken, they will succeed, and we will see the continuation of the uptrend to the next resistance level of 14260.0, located on the upper green wall.


