

The Australian dollar and Canadian dollar are often called “commodity currencies”. That’s why you can see a correlation between their price and the price of commodities like oil or iron ore. Let’s take a look at what’s been going on with AUDUSD and USDCAD recently.
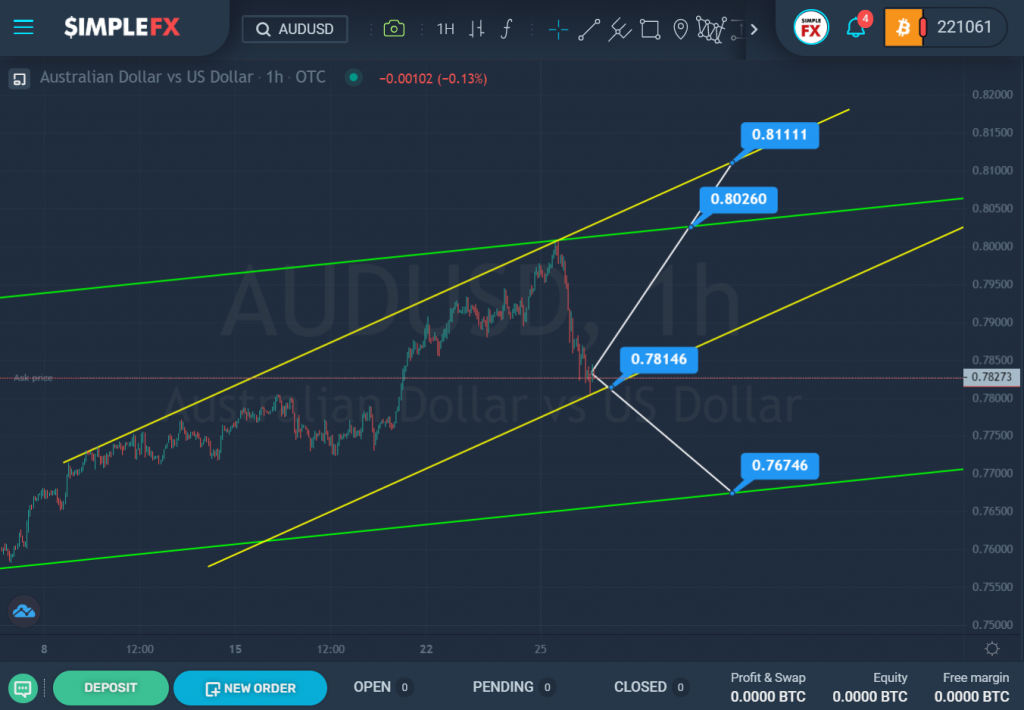
At the time of writing, the AUDUSD currency pair is forming a bullish trend that moves within two channels: green and yellow.
Most recently, the price has reached the upper green line at the point where it intersects with the upper line of the yellow channel. After that, the bulls retreated, and we saw a bearish decline in the currency pair.
Judging by the sharp decline, we can assume that the bears are strong enough to lead the market. If the support level of 0.781, which is on the lower yellow line, breaks, the bears will have a clear path to the next support level of 0.767, which is on the lower green line.
In the alternative, the expected reversal of the market and the upward move of prices. If the price reaches the upper line of the green channel and can break through the resistance level of 0.802, then, most likely, the growth will continue even higher to the resistance level of 0.811, which is on the upper yellow wall.
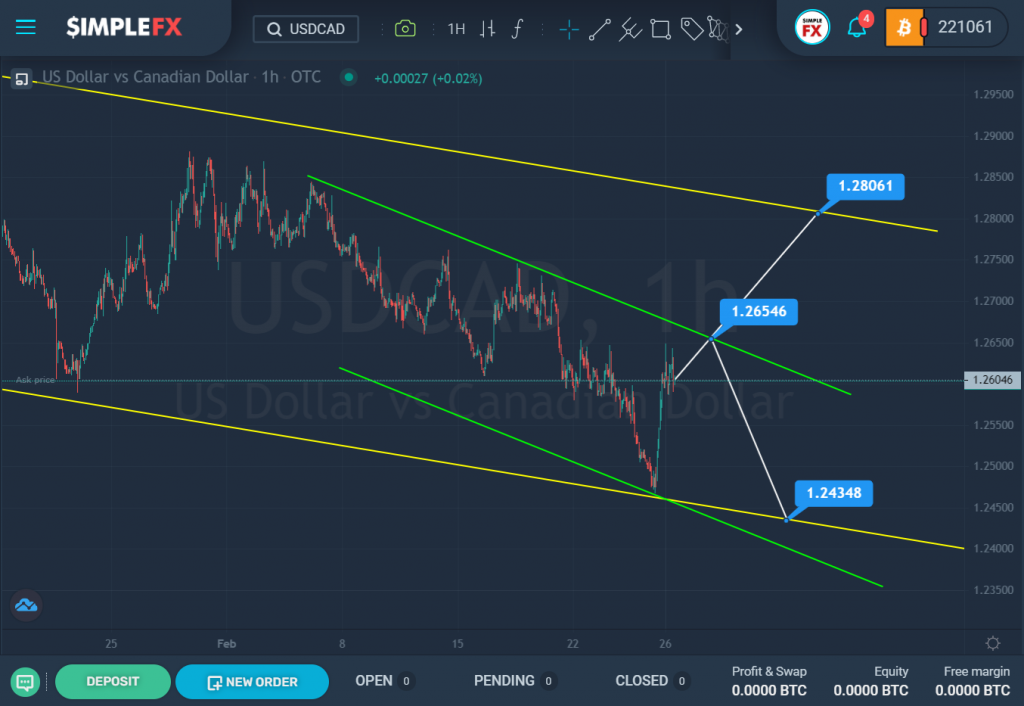
The USDCAD currency pair hints at the construction of a major downtrend. It moves inside the yellow channel, and the last section of the chart describes a small green channel.
Over the past month, the price has been gradually declining and recently touched the lower lines of the yellow and green channels. Then we saw a sharp jump.
It is possible that the bulls have accumulated strength and are now ready to push the price up. At the break of the resistance level of 1.265, our assumption will be confirmed. Then the bulls will open the way to the upper yellow wall and the resistance level of 1.280.
However, if the resistance level of 1.265 is not broken, then we expect a price decline to the lower yellow line and the support level of 1.243.