

The Japanese yen is showing some strong trends recently. This week we analyze USDJPY and GBPJPY. Both are going up as the yen continues to slide, however, GBP is outperforming USD recently. If you trade forex with us, make sure you add these two to your watchlist.
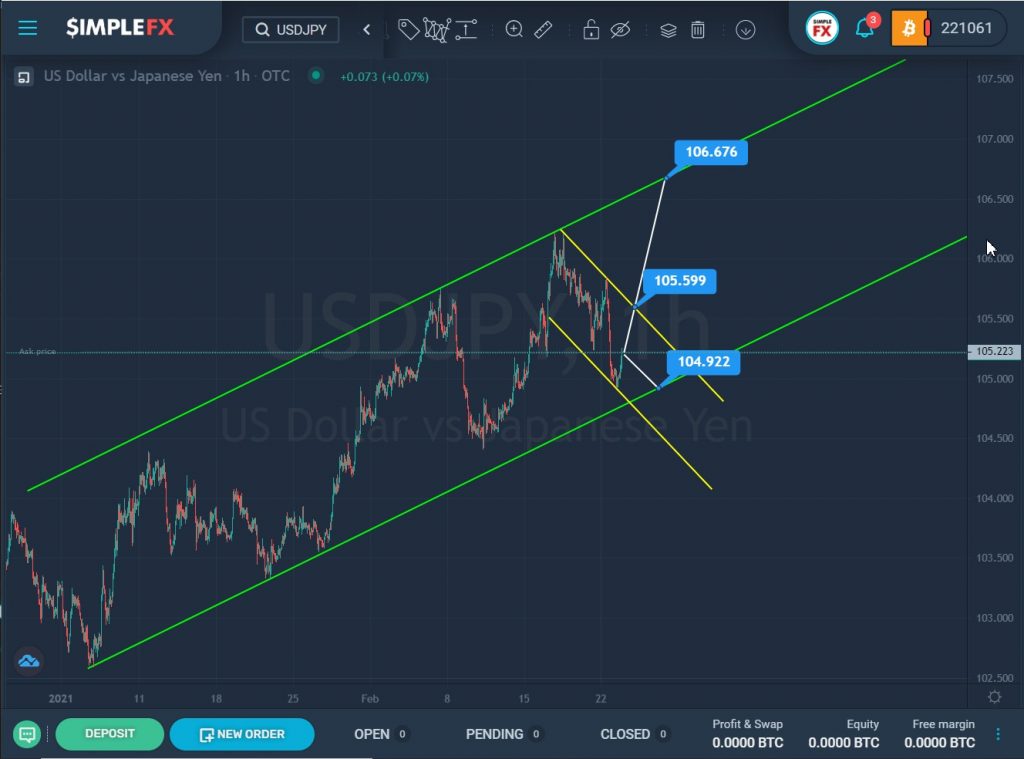
Since the beginning of 2021, the USDJPY currency pair has been forming a major uptrend that moves within the green channel.
We can see that the price was actively moving from the lower to the upper area of the green channel. In the last section, when the market pushed off from the upper green wall, we saw a sharp drop in the price. This section describes a small descending yellow channel.
It is possible that the market will follow the previous scenario and continue to decline towards the lower green line and the support level of 104.92 along the yellow channel.
However, there is a chance that the price will start to rise. If the market reaches the resistance level of 105.59, and can break it, then market participants will expect continued growth to the next important level of 106.67, which is on the upper line of the green channel.
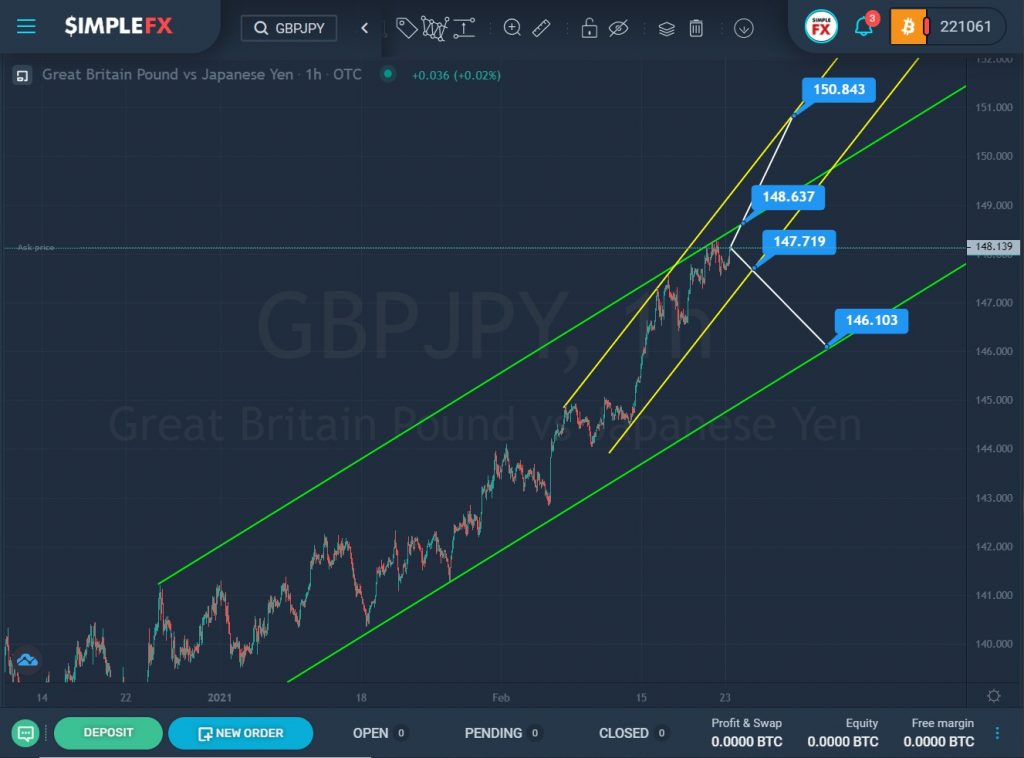
The current formation of the GBPJPY currency pair shows the construction of an uptrend. It moves within the green channel.
After the last rebound from the lower green line, the price slowly began to rise and move to the upper line of the green channel. The last section of the chart describes a small yellow channel.
Recently, the bulls touched the resistance line but did not break it. Perhaps they still have enough strength and they will again approach the green line. In the event of a break of the resistance level of 148.63, the bulls will open the way to the upper yellow line and the resistance level of 150.84.
In the alternative, we expect a bearish price movement. If the support level of 147.71 is successfully broken, which is located on the lower line of the yellow channel, the price decline will continue to the lower support level of 146.10, which is located on the lower green line.