SPX500 has been on the rise long term since March 2020. Now long can we expect it to climb? Take a look at our technical analysis before the US markets open today.
In the second part, we’ll give you some insights on USOIL, which is always related to equity markets. Enjoy and make the best trades!
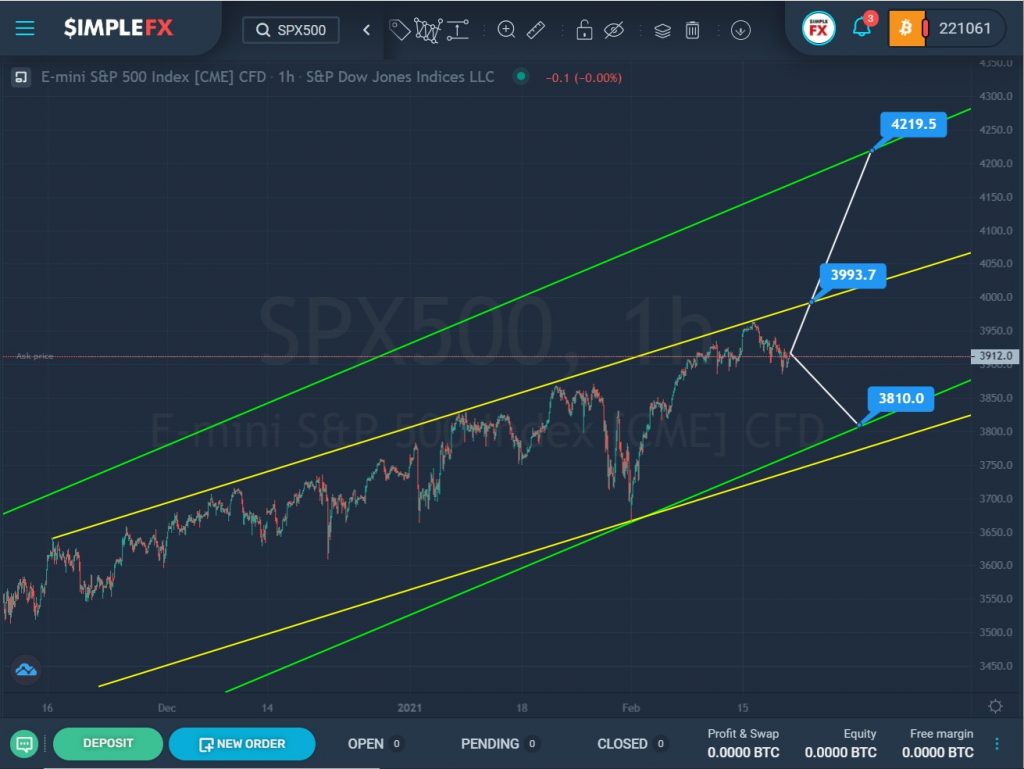
The structure of the SPX500 index shows a bullish trend that moves within two channels: yellow and green.
For a long time, the price was in the upper area of the yellow channel, then we saw a sharp drop down to the intersection of the lower lines of the green and yellow channels, then the growth resumed again.
In the current situation, both continued growth and a decline in the market are possible. If the market reaches 3993.7 and can break through it, then the way to the upper green line and the resistance level of 4219.5 will be open for the bulls.
Otherwise, market participants may see a price decline in the lower green line and the support level of 3810.0.
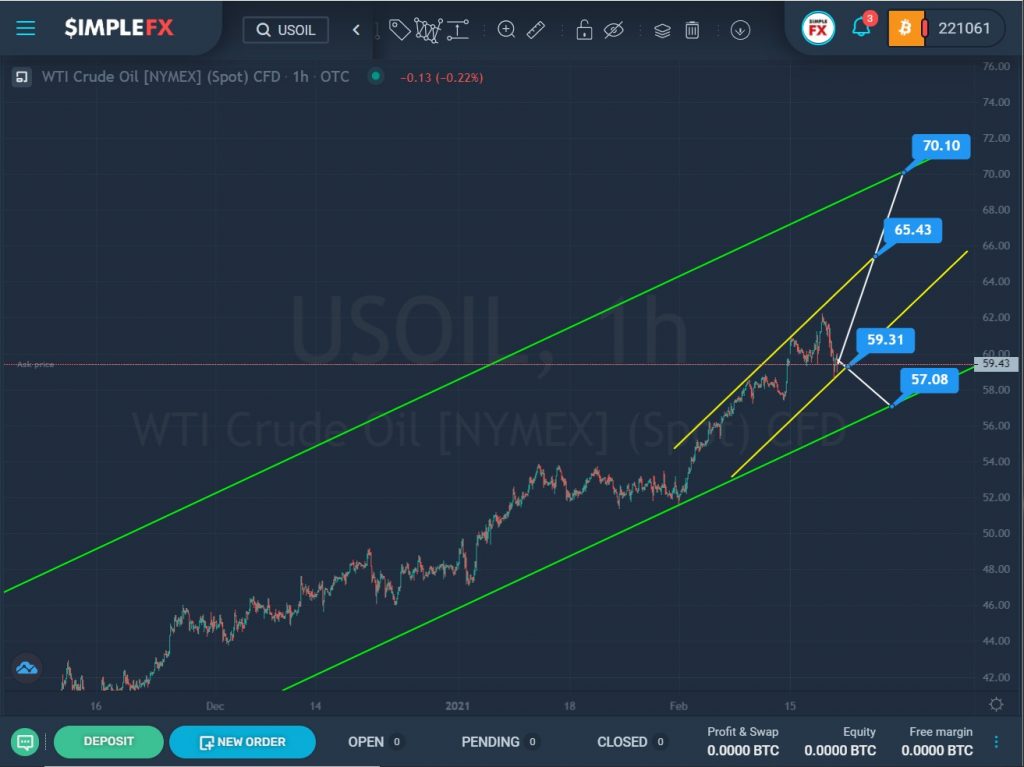
It seems that oil is forming an uptrend. Its construction takes place within the large green channel.
After the last rebound of the price from the lower green line, the market began to move in an upward direction. This section describes a small ascending channel of yellow color.
At the moment, USOIL is located near the lower yellow wall. Perhaps the decline will continue. If the bears manage to break through the support level of 59.31, which is on the lower yellow wall, then the price decline will continue to the lower green line and the next support level of 57.08.
Although the bears have already had an unsuccessful attempt to break through the yellow line, so it is possible that the bulls are stronger and in the near future, we will see a rise in the price. If the bulls reach the resistance level of 65.43 and break it, then the growth can continue to the higher level of 70.10, which is on the upper green line.