

The British pound is on the rise against the US dollar. The American economy is struggling, while GBP is appreciating. Watch our analysis as the pound approaches the $1.4 resistance, a level that has not been achieved since April 2018. Trade pound sterling in the post-Brexit era.
In the second part of our analysis, we take a closer look at XAUUSD. Enjoy!
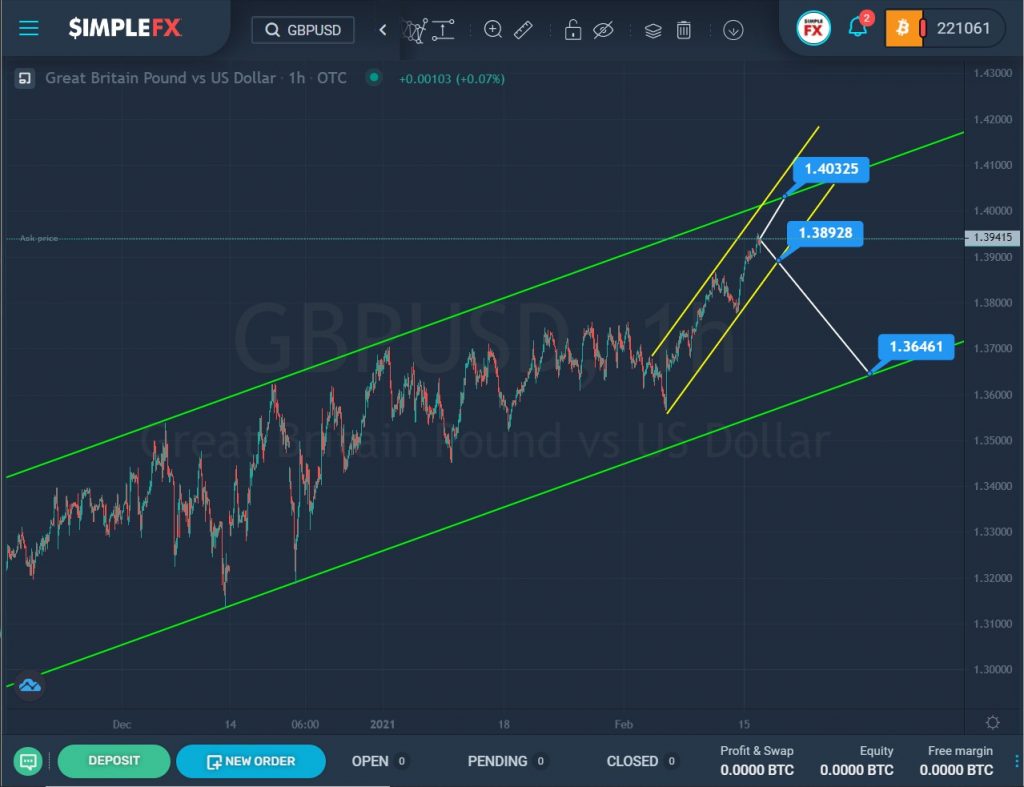
The current structure of the GBPUSD currency pair shows the construction of an uptrend that moves within the green channel.
After the last rebound from the support line of the green channel, the price no longer reached its upper line. In the last month, it has been moving along its center.
The final section of the uptrend describes a small yellow channel.
If the market does not touch the lower yellow wall and does not break through the support level of 1.389, the price will continue to rise to the upper green line and the resistance level of 1.403. But if the bears can break through the lower line of the yellow channel, then they will open the way to the lower green line and the support level of 1.364.
An approximate scheme of possible future movement is shown on the chart.

The XAUUSD structure shows the construction of a large horizontal trend.
After the last rebound from the upper green line, we saw a downward move in the price. This suggests that the market has started to form a new bearish trend.
Our assumption will be confirmed if the price goes down to the lower green wall, and the bears can break through the support level of 1755.60. Then the price of gold can fall even lower – to the support level of 1672.04, which is on the lower yellow line.
However, an alternative option is possible. If the bulls can touch the upper yellow wall and break through the level of 1834.72, then nothing will prevent them from further growth to the upper green line and the next resistance level of 1952.95