


Check out our Friday analysis and enjoy the great opportunities on forex markets. The Turkish lira is at the highest point against the dollar since August. Time to act!

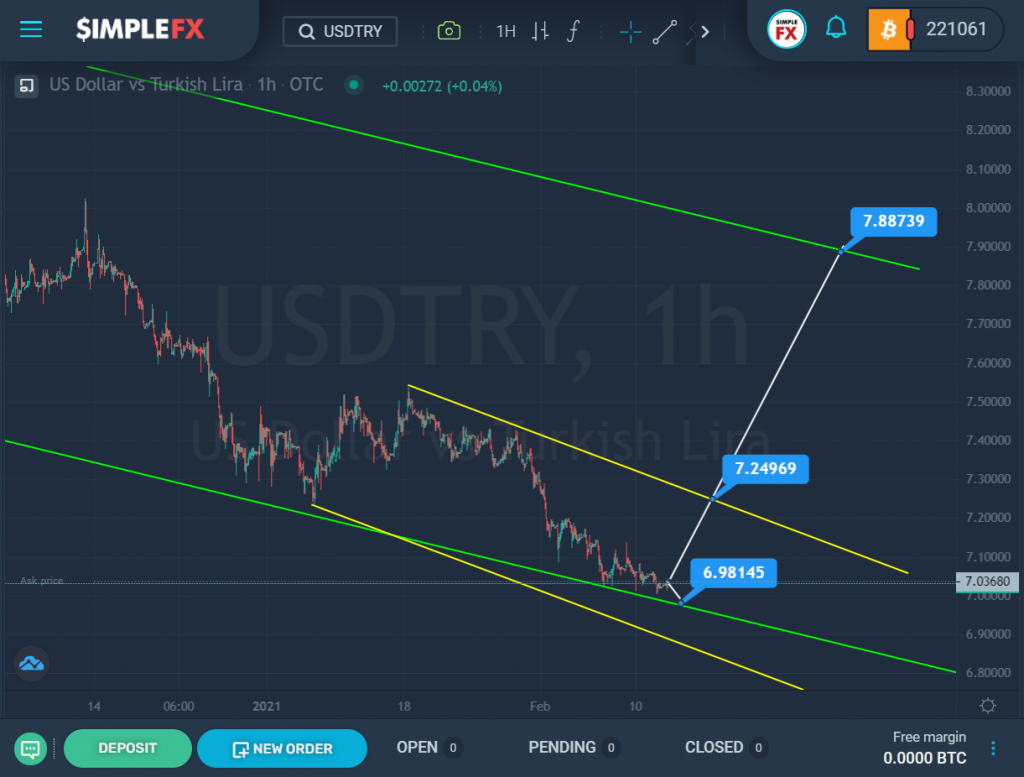
The current structure of the USDTRY currency pair indicates that a major downtrend is forming in the market, which may have already come to an end. The price is right on the support line, which is formed by the lower line of the green channel.
As bears several times pushed away from the line, maybe they never will be able to break this wall down, in this case, the market is expected to rise to the top of the yellow wall, and the resistance of 7.249. Further, if the bulls manage to break the target level, they will open new prospects for growth towards the next significant resistance line, that is, to the upper line of the green channel and level of 7.887.
An alternative scenario is the continuation of the price movement along the green support line above the level of 6.981. However, even if the bears manage to break through this line and the level of 6.981, very soon they will be waiting for a new support line, that is, the lower line of the yellow channel. Therefore, it is unlikely that we will see an active decline in the current situation. The priority, in this case, is given to the bulls.

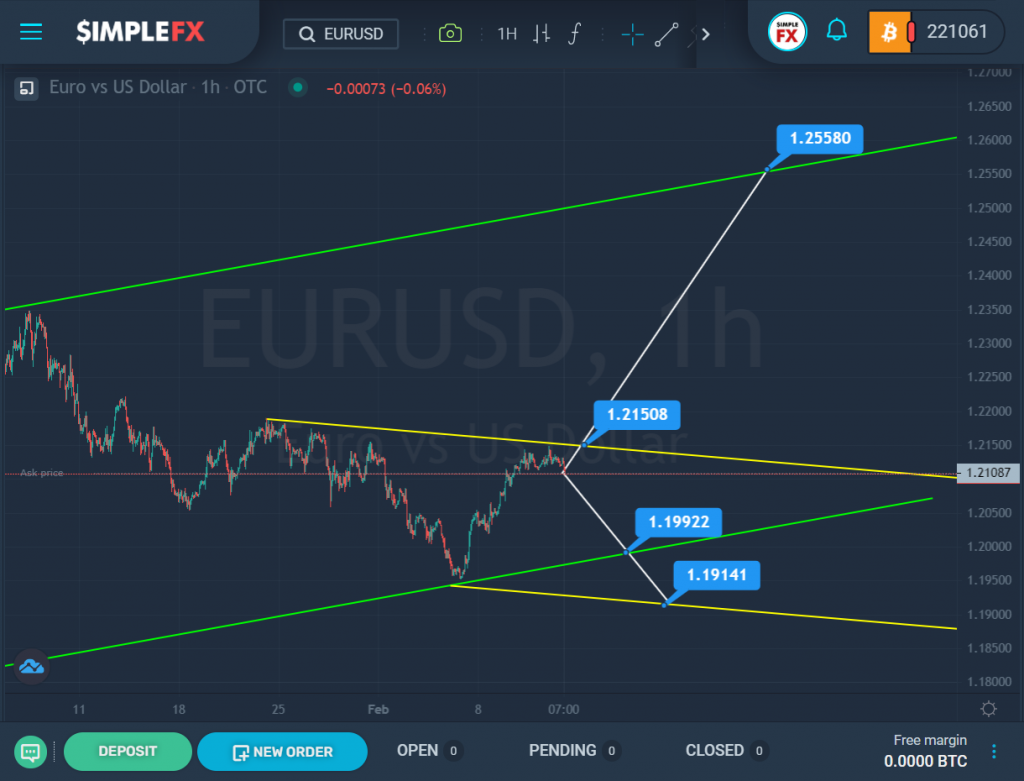
For EURUSD, the market moved in an uptrend for a long time, then we saw a systematic decline from the upper line of the green channel to its lower wall. On the final part of this decline, a yellow descending channel was built.
After the bears reached the lower line of the green channel, the price pushed off from it and began to move up. It is possible that this way the multi-month uptrend continued.
If the assumption about the continuation of the bullish trend is correct, then the market will soon break through the upper line of the yellow channel and the resistance level of 1.215, after which the rise of the currency pair will continue to the upper green wall and the resistance line, where the target level of 1.255 is located.
An alternative scenario is a rebound from the upper yellow line and a decline to the lower wall of the green channel and the support level of 1.199. If this target level is broken, the bears will continue to move down to the lower yellow line and the level of 1.191. The approximate scheme of possible movement is schematically indicated on the chart.


