

It’s a historic week for bitcoin. We’ll try to give you some hints on where could the cryptocurrency go in the next hours. In the second part, we Enjoy!
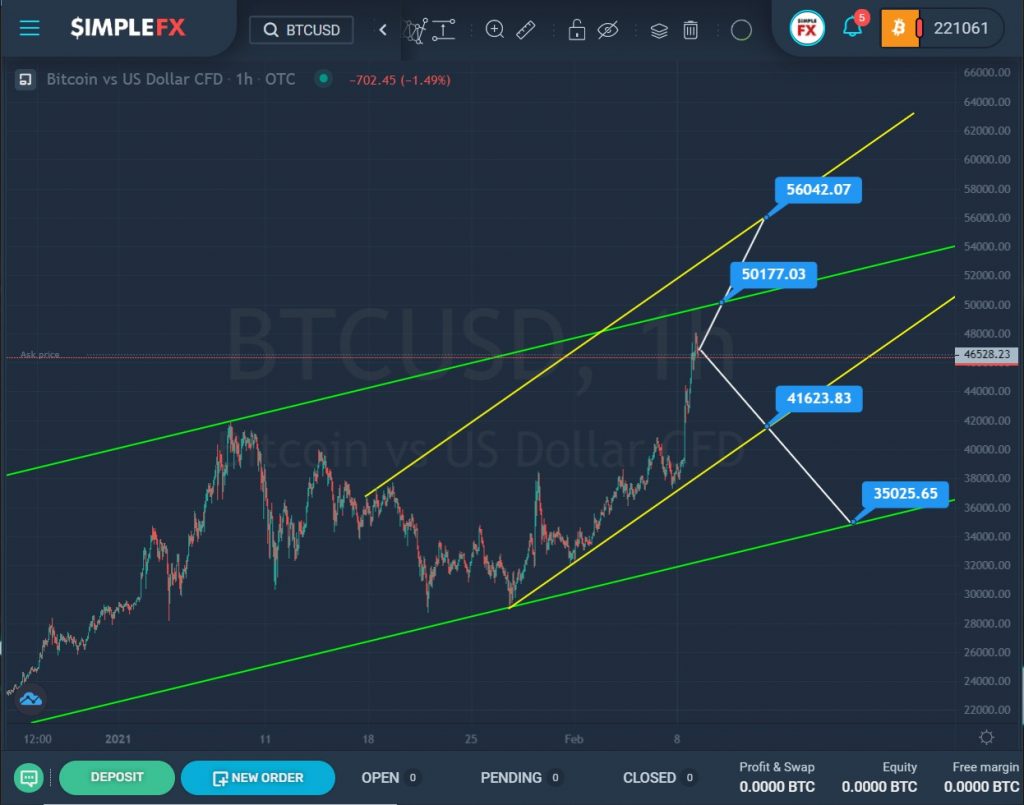
The current structure of the BTCUSD cryptocurrency pair hints at the construction of a large bullish trend that moves inside the green channel.
Not so long ago, the price moved in a downward direction from the upper line to the lower line of the green channel, after which it pushed off and moved up.
The last section describes the yellow channel. For some time, the price was in the lower area of the yellow channel, then it jumped sharply and almost reached the upper green wall. Perhaps the growth will continue. If the price reaches the resistance level of 50177.03, which is on the green line, the market will open the way to the next important level of 56042.07, which is on the upper wall of the yellow channel.
Alternatively, we can see Bitcoin depreciating to the lower yellow line and the support level of 41623.83, and if this level is broken, the decline may continue to the lower support level of 35025.65, which is on the lower green wall.
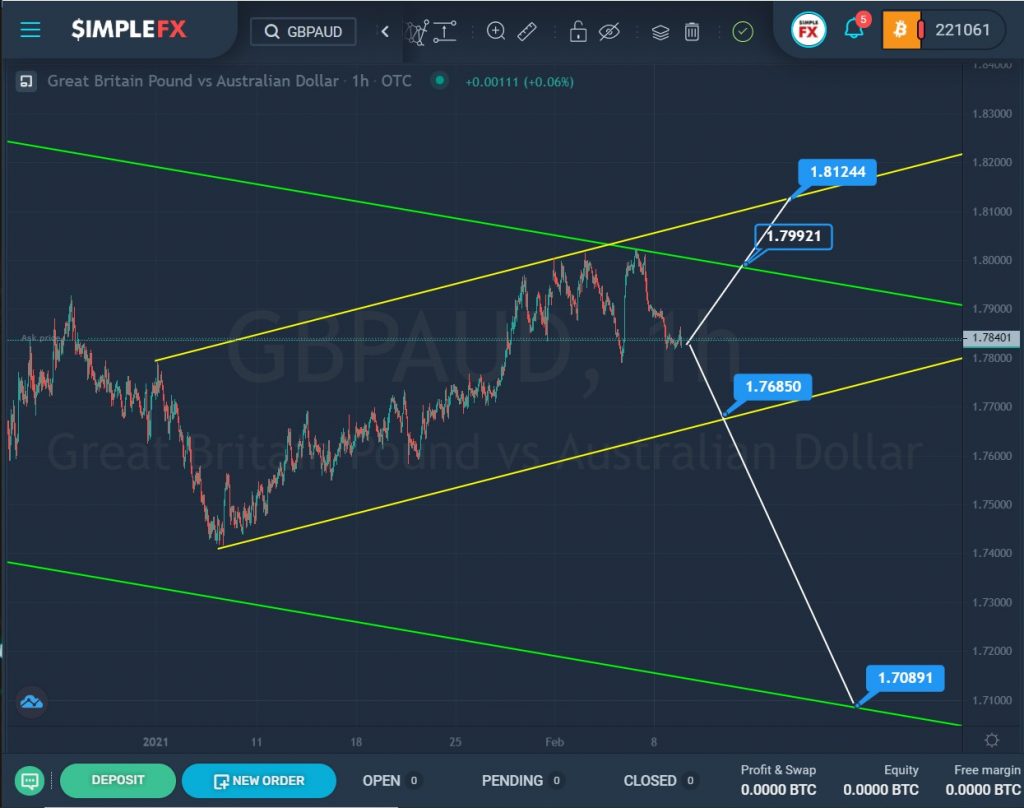
A closer look at the 1H timeframe shows the final section of the global bearish trend, which moves within the green channel.
Over the past month, we have seen a price increase within the ascending yellow channel. Recently, it touched the upper green wall but did not break through it.
Perhaps the bulls will try to go up again and if the resistance level of 1.799, located on the upper green line, is successfully broken, they will be able to do so. In this case, we will expect the growth of the currency pair to the upper yellow wall and the resistance level of 1.812.
However, the current situation may hint at the weakness of the bulls. Then the market will be dominated by a bearish price move. If the price reaches the support level of 1.768, which is on the lower line of the yellow channel, then it will open the way to the lower green wall and the support level of 1.708.