


DJ30 rose again yesterday and is up 4.6% again. Strong macroeconomic data are fuelling growths. Take a look at our analysis before today’s trading begins. We also discuss EURJPY – an interesting pair for forex traders

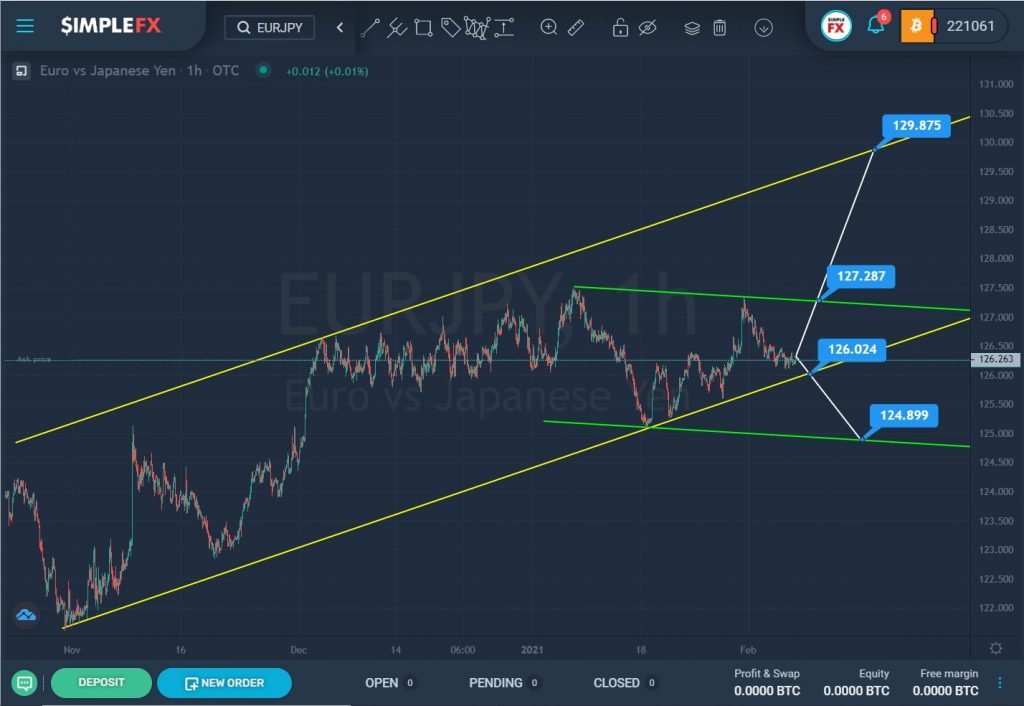
The formation of the EURJPY currency pair hints at the construction of an uptrend that moves within the yellow channel.
In the last section of the chart, we can see that the price pushed off from the upper line and went down to the lower line of the yellow channel. The descending green channel describes the price behavior in more detail.
Currently, the market is in the center of the green channel and in the lower area of the yellow channel. It is quite possible that the price will touch the lower yellow wall, and in the event of its break in the 126.02 area, the decline may continue to a lower support level of 124.89, which is on the lower green line.
Alternatively, we consider a situation where the strength of the bull prevails over the strength of the bears. If the bulls can reach the resistance level of 127.28, located on the upper green line, and then break through it, then they will open the way to the upper yellow wall and the resistance level of 129.87.

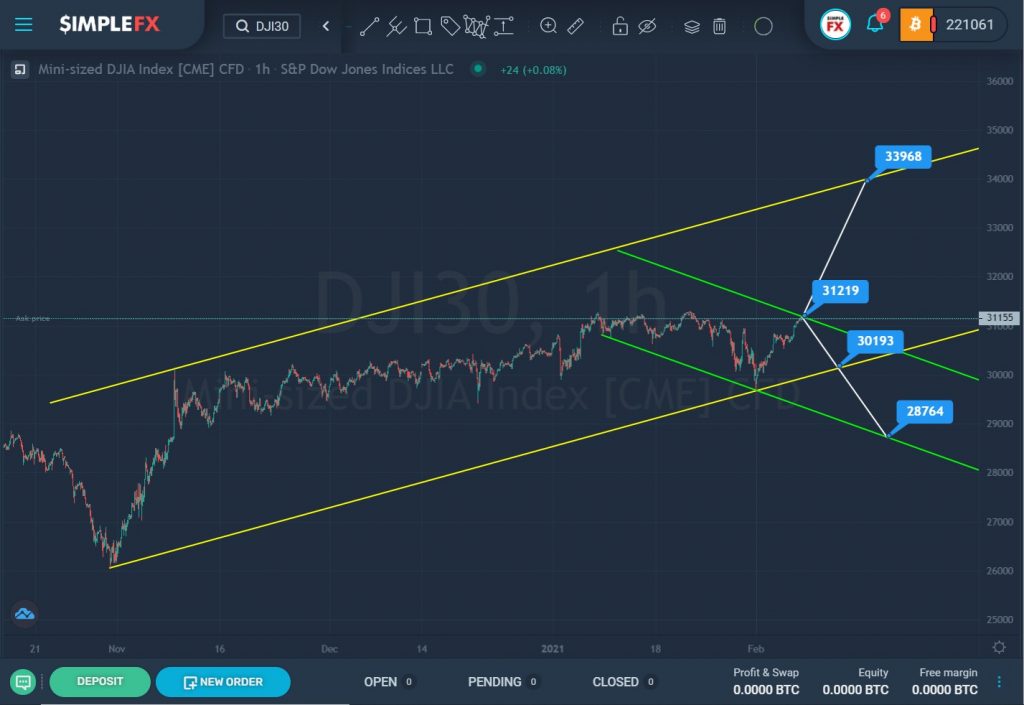
The DJI30 stock index shows a bullish trend that moves within a large yellow channel. For a long time, the price moved from its upper line to the lower one.
The last section of the chart describes the descending green channel.
Recently, the price pushed off from the lower yellow line, where the walls of the yellow and green channel intersect, and began to grow. Now the price has reached the upper green line. If the market can break through the resistance level of 31219, which is on it, then the price growth will continue towards the upper yellow line and the resistance level of 33968.
However, in the event of a pullback in the price, we can expect a drop in the market. The first target is the support level of 30193, which is on the lower yellow wall. If this level is successfully broken, market participants will continue to decline to a lower support level, which is on the lower line of the green channel.


