

NDX100 dropped sharply yesterday. How should we interpret these swings? Let’s take a closer look. In our Friday analysis, we also wonder where USDCAD is heading next.
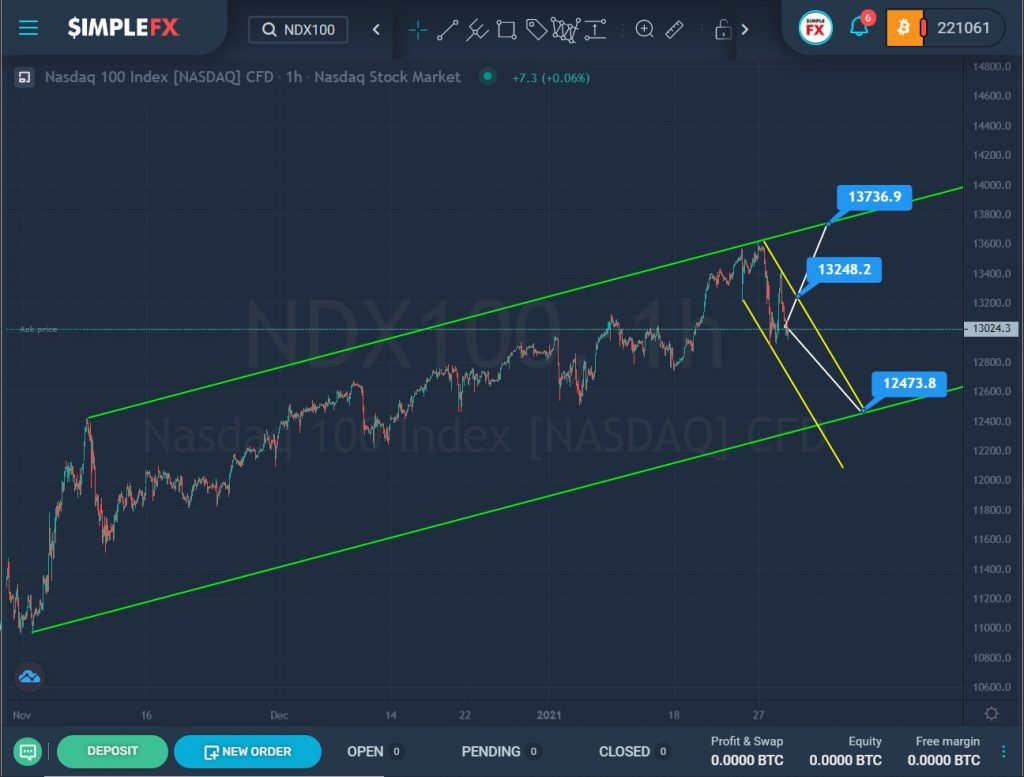
The NDX100 index forms an uptrend that moves within the green channel.
For the last two months, the market has been moving in the upper zone and in the center of the channel, not reaching the upper line. But recently, the price managed to reach the upper green wall, but did not break through it, and began to fall. This section describes a small yellow descending channel.
It is possible that the bulls will still try to take over the market, this will happen with a successful break of the resistance level of 13248.2, which is on the upper yellow line. Then the bulls will have a clear path to the upper green line and the resistance level of 13736.9.
However, after the pullback from the green wall, the price began to fall rapidly, this hints at the strength of the bears. Thus, the alternative scenario assumes that the market continues to fall to the lower green wall and the support level of 12473.8, where the upper yellow and lower green lines intersect.
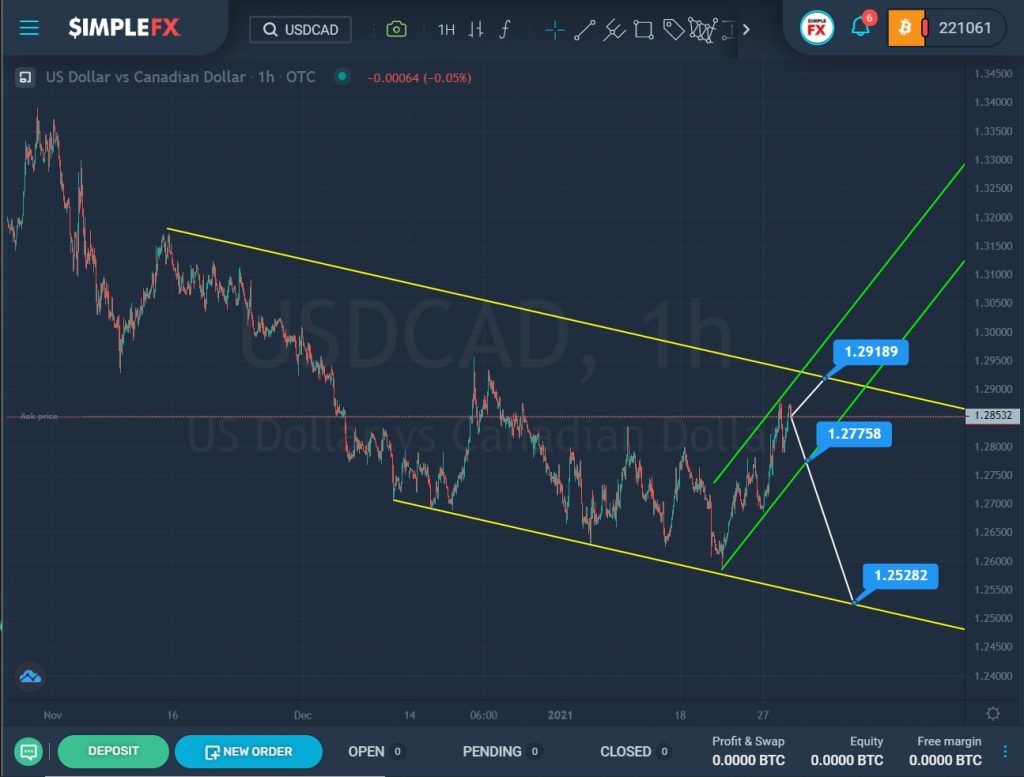
The USDCAD currency pair is moving in a downward direction within the yellow channel, forming a bearish trend.
Over the past couple of months, the price has touched the lower yellow wall several times, then turned around, reached the middle of the channel, and again returned to the lower green zone.
After the last rebound from the lower yellow wall, the market began to grow rapidly. This section describes the ascending green channel. It is possible that its growth will continue further to the upper yellow line and the resistance level of 1.291 if the lower green line is not broken.
However, if the market touches the lower line of the green channel and breaks through the support level of 1.277, then market participants will expect a continuation of the price decline to the next important support level of 1.252, which is on the lower yellow line.