


We have experienced a huge drop in cryptocurrency prices recently. Was it a correction or a beginning of a downtrend? Take a look at our chart analysis.
Additionally, we’ll discuss the Turkish lira price trend, which is always an interesting currency to trade.

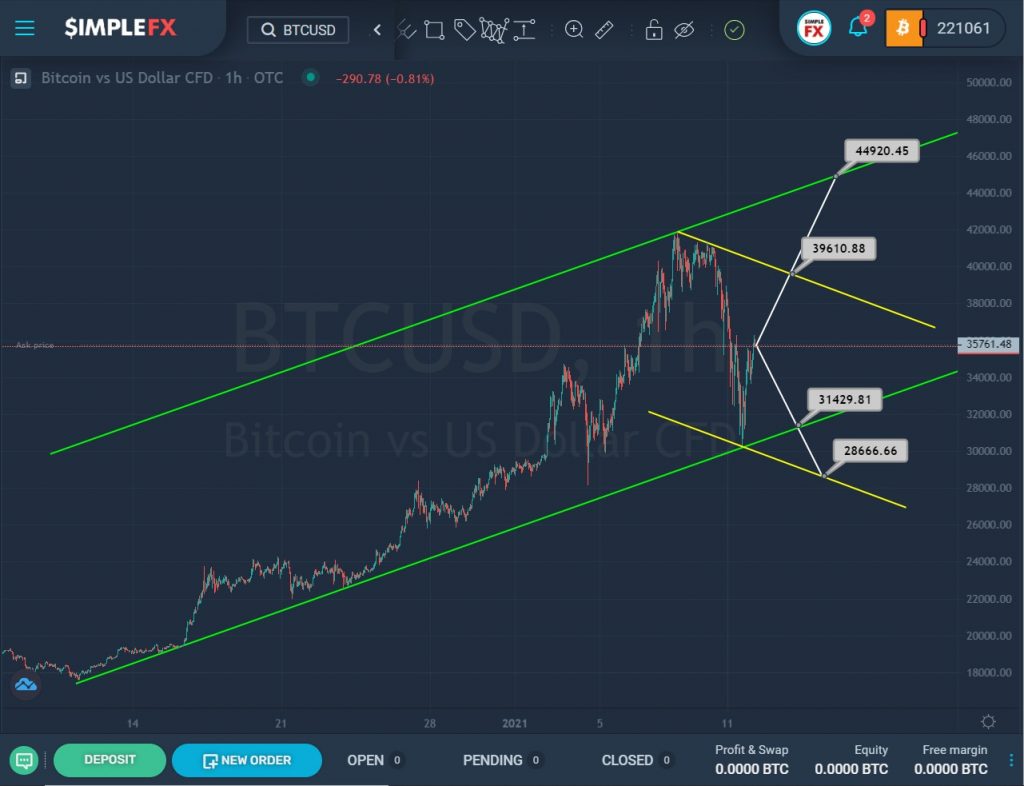
The chart shows the structure of the BTCUSD cryptocurrency pair. We see that a bullish trend is forming, which moves within a large green channel.
For some time, the price was in the area of the lower green zone, but at the end of December 2020, it began to rise rapidly and reached the upper green wall, but did not break through it, it fell sharply down to the lower green wall. The last section describes the descending yellow channel.
At the time of writing, the market is almost in the center of the green and yellow channels. Perhaps the bulls still have the strength to lead the market up. If the price touches the upper yellow line and breaks through the resistance level of 39610.88, then the bulls will open the way to the upper green line and the resistance level of 44920.45.
However, the sharp drop may hint at the strength of the bears. In this case, we can expect a continuation of the price decline to the lower green wall. With a successful break of the support level of 31429. 81, which is on this wall, we could see the continuation of the downward trend in the direction of the support level of 28666.66, which is on the lower line of the yellow channel.

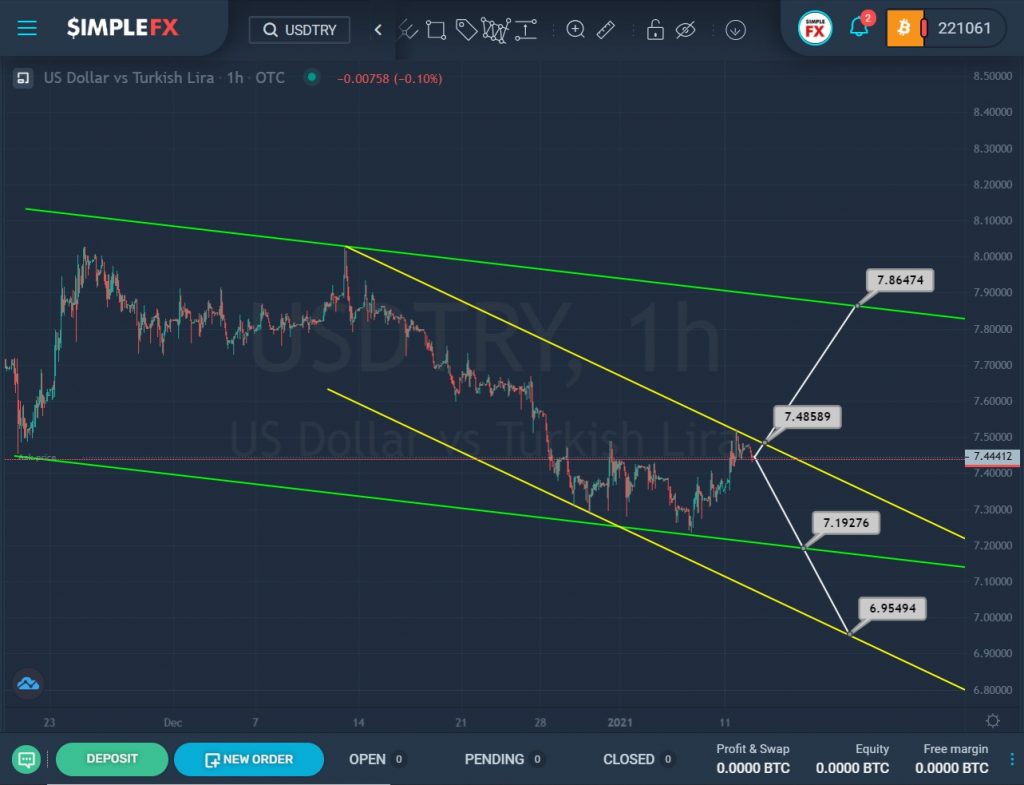
The USDTRY currency pair moves in a downward direction within a large green channel, as well as within a small yellow channel, which describes the price behavior in the last section of the chart.
After the last rebound from the upper lines of the two channels, the price gradually began to decline. Not so long ago, the market touched the lower line but did not break it. The price rebounded and continued its upward movement.
If the growth continues, and the upper yellow line is broken in the area of the resistance level of 7.485, then market participants can observe a bullish growth towards the upper green wall and the next important resistance level of 7.864.
It is possible that the bulls do not have enough strength, as they have already made an attempt to break through the upper yellow line, but they did not succeed. In this case, the price is expected to decline in the direction of the support level of 7.192, which is on the lower green wall. If the specified level is successfully broken, the market will open the way to the next support level of 6.954, located on the lower yellow line.


