

The British pound is losing against the major currencies today. Investors are worried about the long term consequences of Brexit and the COVID-19 pandemic. Take a look at our analysis, and trade GBP forex pairs as they seem to offer the biggest opportunities this week.
On the other hand, Nasdaq shows the continuation of the bull stock market. There are only three days left of trading this year. Use our chart analysis to trade the index as well as its components. Enjoy!
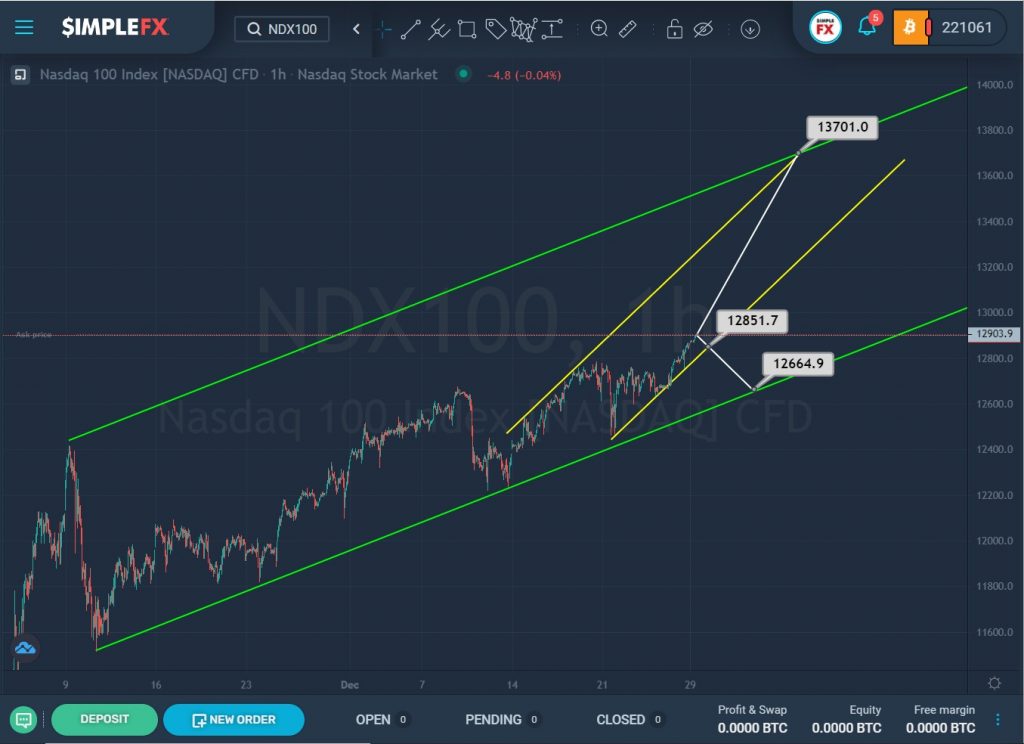
The NDX100 index is moving in an upward direction within the green channel, forming a bullish trend.
For some time, the price moved in the lower zone of the green channel, reaching only its middle. After the last rebound of the price from the lower green wall, the market gradually grows up. The last section describes the yellow channel in more detail.
Currently, the market is near the lower yellow wall. There is a possibility that the previous scenario will repeat, in other words, if the bears can break through the support level of 12851.7, which is on the lower line of the yellow channel, then the price decline will continue to the lower wall of the green channel and the support level of 12664.9.
But if the lower yellow wall is not broken, then market participants expect the price to rise in the direction of the resistance level of 13701.0. The target is at the intersection of the upper lines of the two channels.
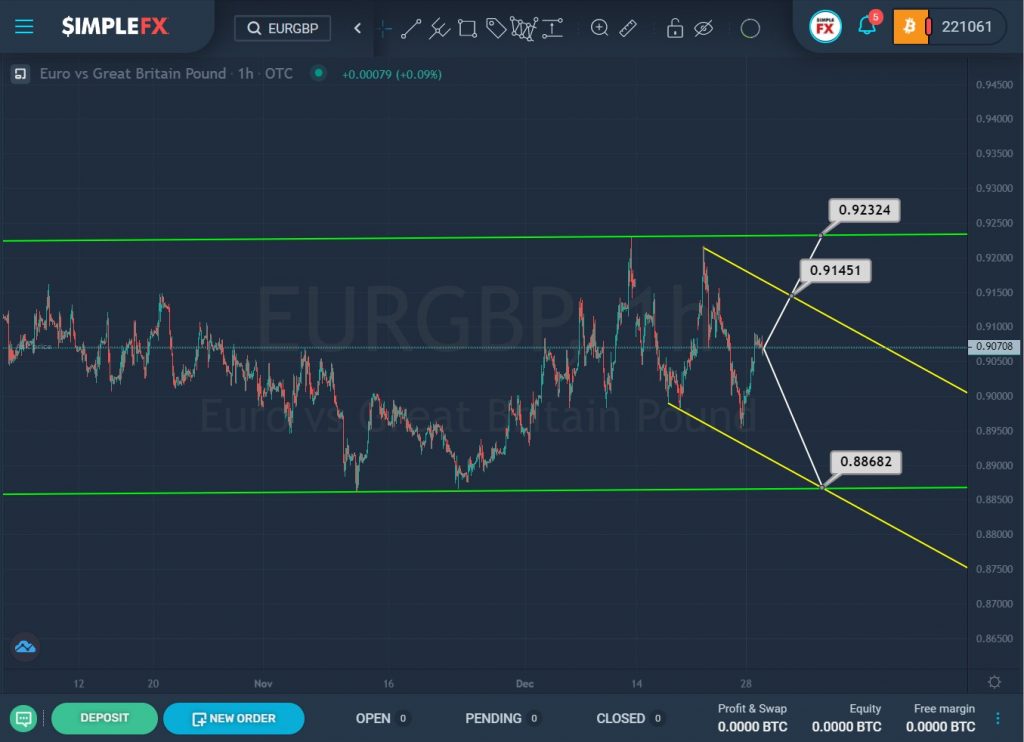
The current EURGBP structure shows the development of a horizontal trend that moves within a large green channel.
Not so long ago, the market pushed off from the upper green wall and began to move down. This section describes the descending yellow channel.
Since the bulls have already attempted to take over the situation, there is a chance that they still have strength, and they will be able to reach the upper yellow line. If the resistance level of 0.914, which is on this line, breaks, the bulls will open the way to the next important level of 0.923, which is located on the upper green line.
Alternatively, we could see the price decline in the direction of the level of 0.886, which is located at the intersection of the two lower walls of the green and yellow channels.