

Tesla will be included in the S&P 500 index on Monday, December 21. How will the move affect the market? Nobody knows, but we hope our technical analysis of SPX500 shows some trading opportunities this weekend. The NYSE is going up.
US stimulus is progressing which also influenced oil prices. USOIL is trading up nearing the 9-month records. Since April oil prices have risen by over 300%.
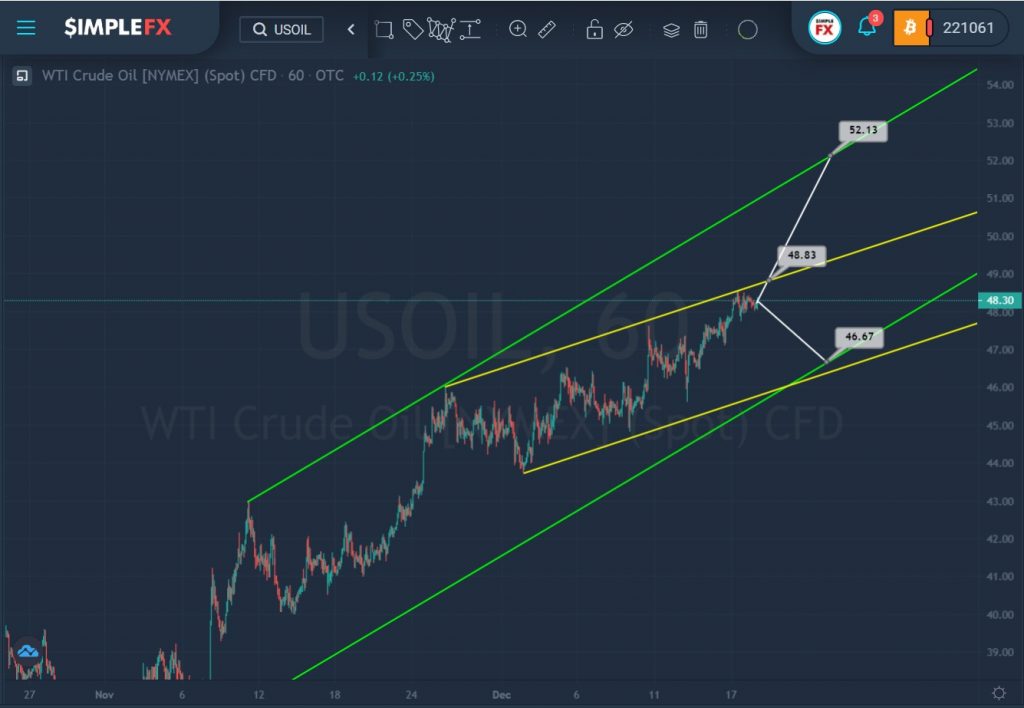
The USOIL structure shows a bullish trend that is growing rapidly within the green and yellow channels.
In the last section of the chart, we see that the price touched the upper yellow wall, but did not break through it.
At the moment, the price is near the upper yellow line, so the bulls may try to push the market up again. With a successful break of the resistance level of 48.83, located on the upper yellow wall, they will be able to do this and open the way for them to the upper green line and the resistance level of 52.13.
Alternatively, market participants may see the price drop to the lower green line and the support level of 46.67.
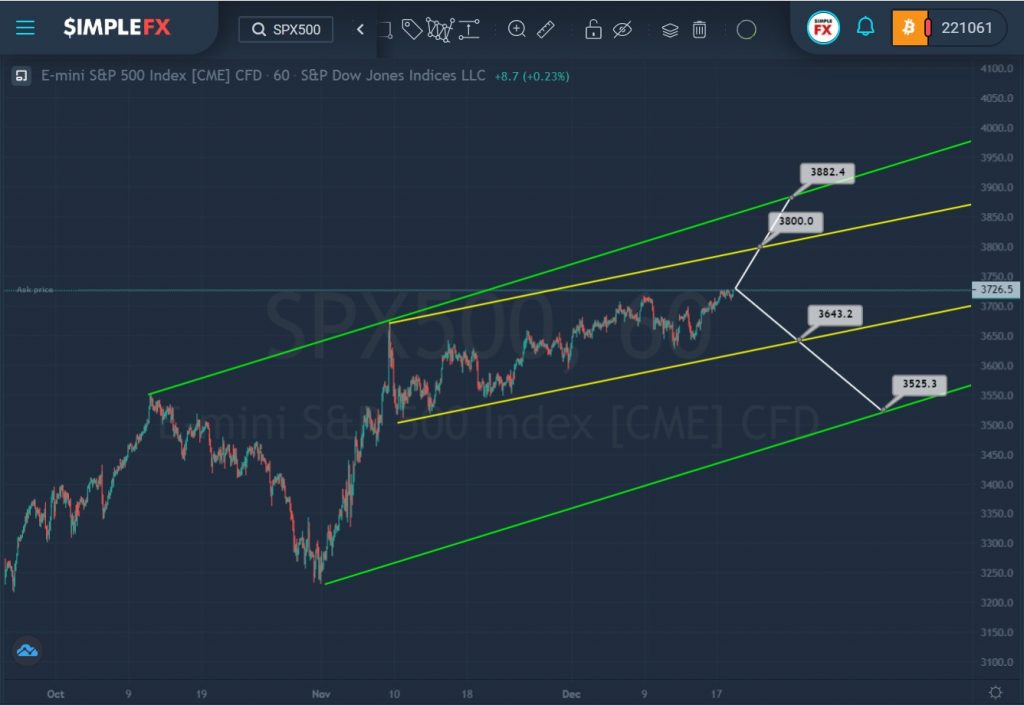
We see the formation of an uptrend that moves within a large green channel.
Not so long ago, the price touched the upper green wall but did not break through it. After that, we saw a sideways movement of the market with an upward slope inside a small yellow channel.
In the current situation, both the growth of the market and its decline are possible. If the price reaches the upper yellow line and breaks through the resistance level of 3800.0, then we can observe a continuation of the price increase to the next resistance level of 3882.4, which is on the upper green wall.
An alternative option involves reducing the price. The first target is the support level, which is on the lower yellow line. With a successful break of that level, we could see a continuation of the depreciation of the index to the support level of 3525.3, located on the lower green line.