


Today we have an analysis of XAUUSD and GBPUSD for you. Both assets are at very interesting points at the moment. Take a look at the charts below and trade accordingly.

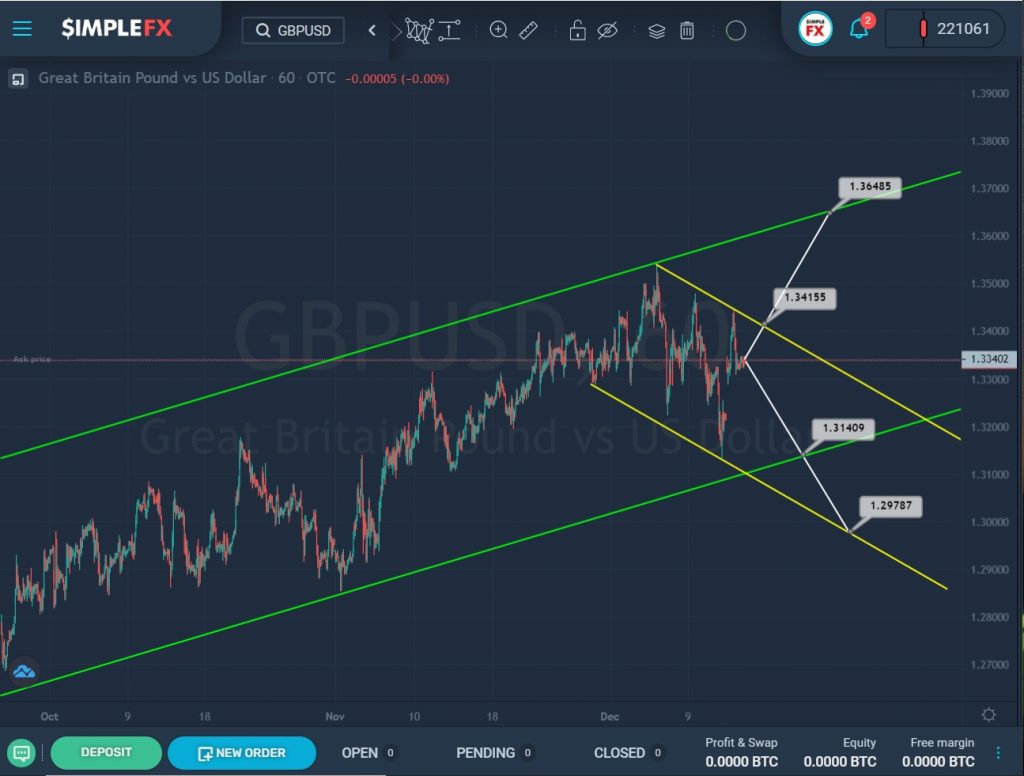
The formation of the GBPUSD currency pair hints at the construction of an uptrend that moves within the green channel.
Over the past month, the price has been growing from the lower line of the green channel to its upper line. After that, we saw a rebound in the price and its decline. This section describes the yellow channel.
In the last section of the chart, we see how the price drops sharply and then increases rapidly, but it does not go beyond the lines of the yellow channel.
If the bulls can reach and break through the resistance level of 1.341, which is on the upper yellow wall, then they will open the way for further growth to the upper green line and the resistance level of 1.364.
But it is possible that the bears will again try to lead the market. If they manage to reach the lower green line and break the support level of 1.314, then we could see the pair devalue to the lower support level of 1.297, which is on the lower yellow line.

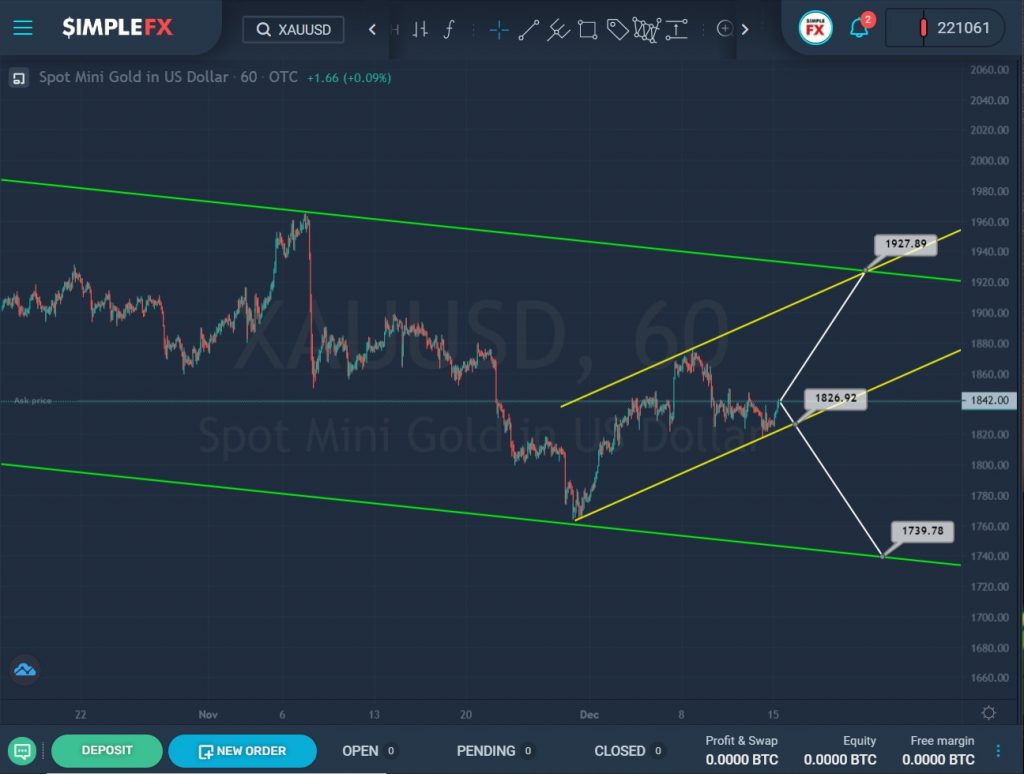
We see the development of a downtrend that moves inside a large green channel.
Over the past month, the price went down from the upper wall to the lower wall, followed by a rebound in the price.
Currently, we see the market growing inside a small yellow channel.
Perhaps in the near term, the increase in the price of gold will continue in the direction of the resistance level of 1927.89, which is at the intersection of the upper walls of the two channels.
However, if the bears continue to lead the market down for some time, and they manage to break through the lower wall of the yellow channel near 1826.92, then we expect gold to devalue to the level of 1739.78, which is on the support line of the green channel.


