


Turkey may face US sanctions after the acquisition of the Russian S-400 air defense system. The relations between the two NATO allies have worsened recently. Lira dropped heavily in response to the rumors.
Independently the European Union has prepared sanctions on Turkish individuals in response to the energy dispute with Greece and Cyprus. Harsher steps by Brussels are expected to come in March.
Take a look at our analysis. In the second part of this post, we also take a closer look at EURUSD, which is showing some interesting trading opportunities too.

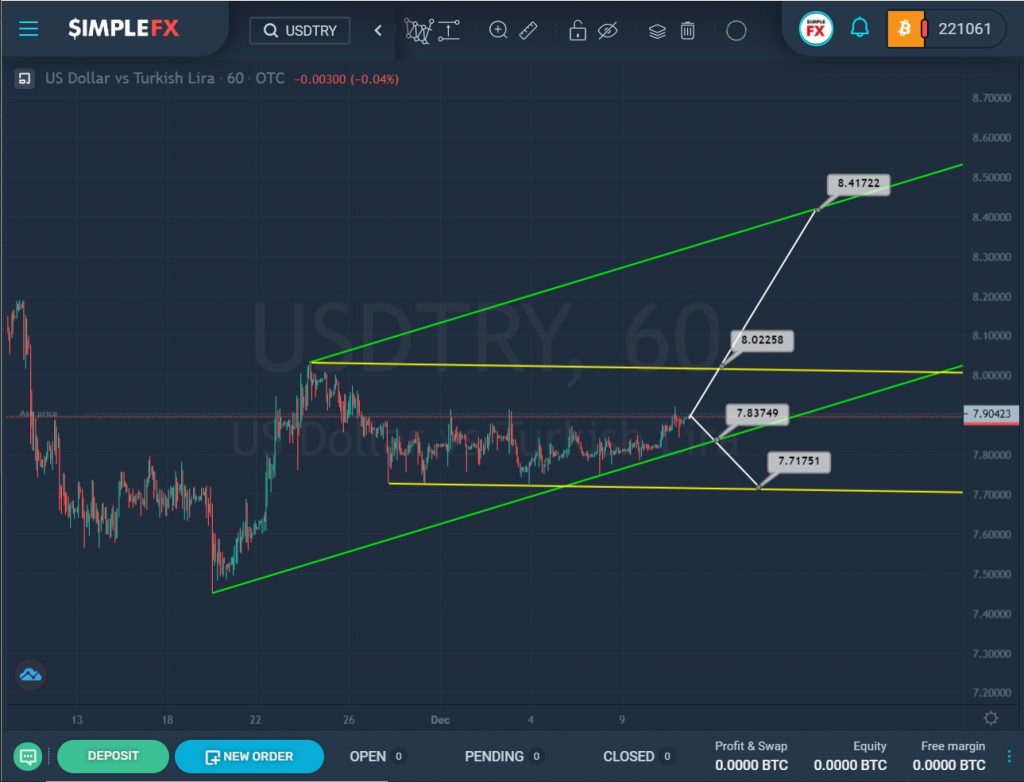
In the last section of the chart, we see the horizontal movement of the market inside the green and yellow channels.
During the last trading weeks, the price has been in the lower zones of these two channels.
In the current situation, there are two possible price movements. The first option considers the situation when the market reaches the resistance level of 8.022, which is on the upper yellow wall. The break of this mark, we can see continued growth to the top of the green line and the resistance level of 8.417.
In the second option, we could see the price fall initially to the support level of 7.837, which is on the lower green line, then, if this level is successfully broken, we can see the currency pair continue to devalue to 7.717, which is on the support line of the yellow channel.

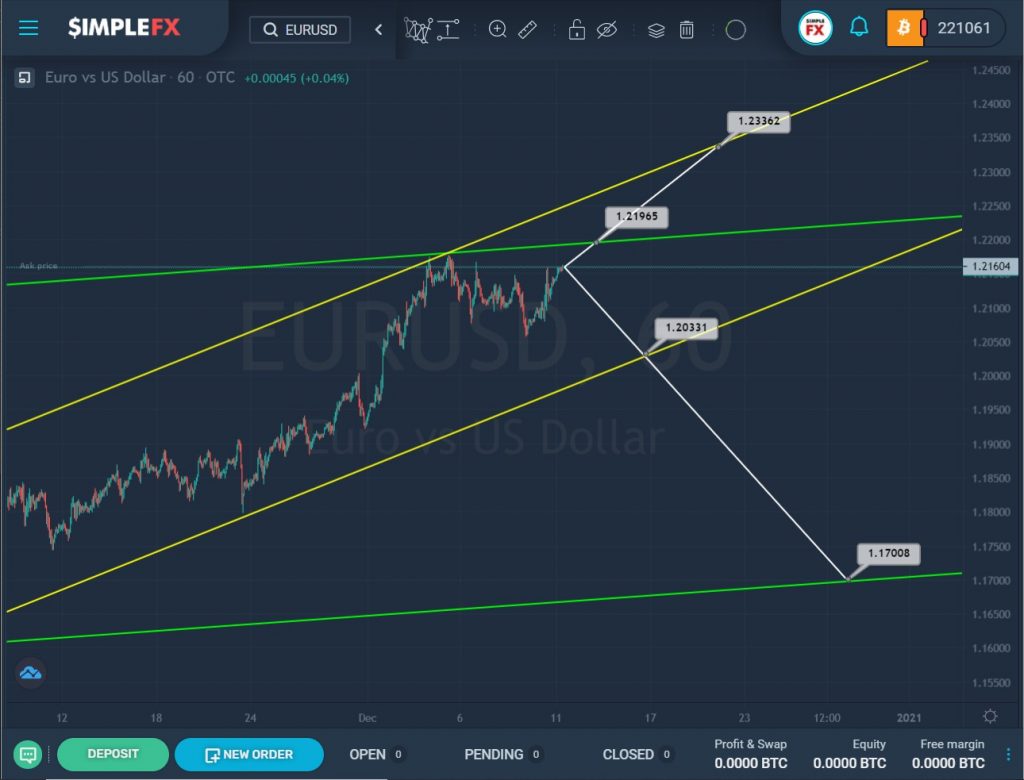
The formation of the EURUSD pair hints at the construction of a bullish trend that moves within a large green channel.
For a long time, the price moved from the lower line to the upper line of the green channel inside the yellow channel. Not so long ago, the market pushed off from the intersection of the upper lines of these two channels and began to move down.
It is possible that the bulls will still try to master the situation and again lead the price in an upward direction. When the resistance level of 1.219 is reached and it breaks, the currency pair will open the way to the upper yellow wall and the resistance level of 1.233.
Alternatively, it is assumed that the bears will not yield to the bulls, therefore, we expect a decline in the price. The first target is the support level of 1.203, which is on the lower yellow wall. If it breaks, we could see a continuation of the decline to the next support level of 1.170, which is on the lower green line.


