


BTCUSD dropped back to $19,000 after a gallant attack at $20,000. Anything can happen now this is a historic moment which finally should lead to a price explosion, or a downfall similar to the one we’ve already experienced in 2018. BUY or SHORT cryptocurrencies while you can!
At the same time, GBP is the forex star. Brexit saga is at the turning point as the UK government has only time till the end of this month to reach an agreement with Brussels. Take a look at the GBPAUD pair analysis, trade, and profit.

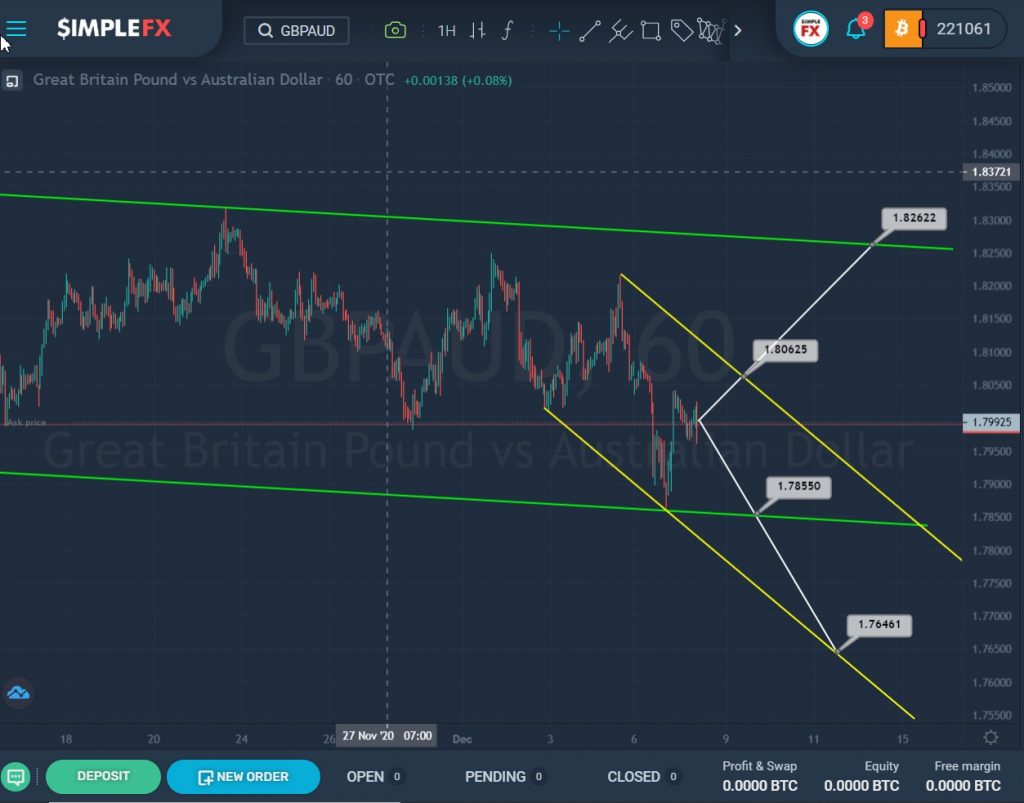
The currency pair is moving within a large green channel.
After the last rebound of the price from the upper green wall, the market began to move rapidly down. Recently, the price touched the lower green line and pushed off from it. In more detail, the price behavior on the last section of the chart is described by a small descending yellow channel.
We see that at the moment the market is in the center of the yellow channel, therefore, both an increase and a fall in prices are possible.
If the market moves up and reaches the resistance level of 1.806, then, if it breaks, the GBPAUD pair will open the way to the upper green line and the resistance level of 1.826.
Alternatively, the price is expected to decline to the support level of 1.785, which is located on the lower line of the green channel. If this level is broken, the bears will be able to continue moving down to the next important support level of 1.764, located on the lower line of the yellow channel.
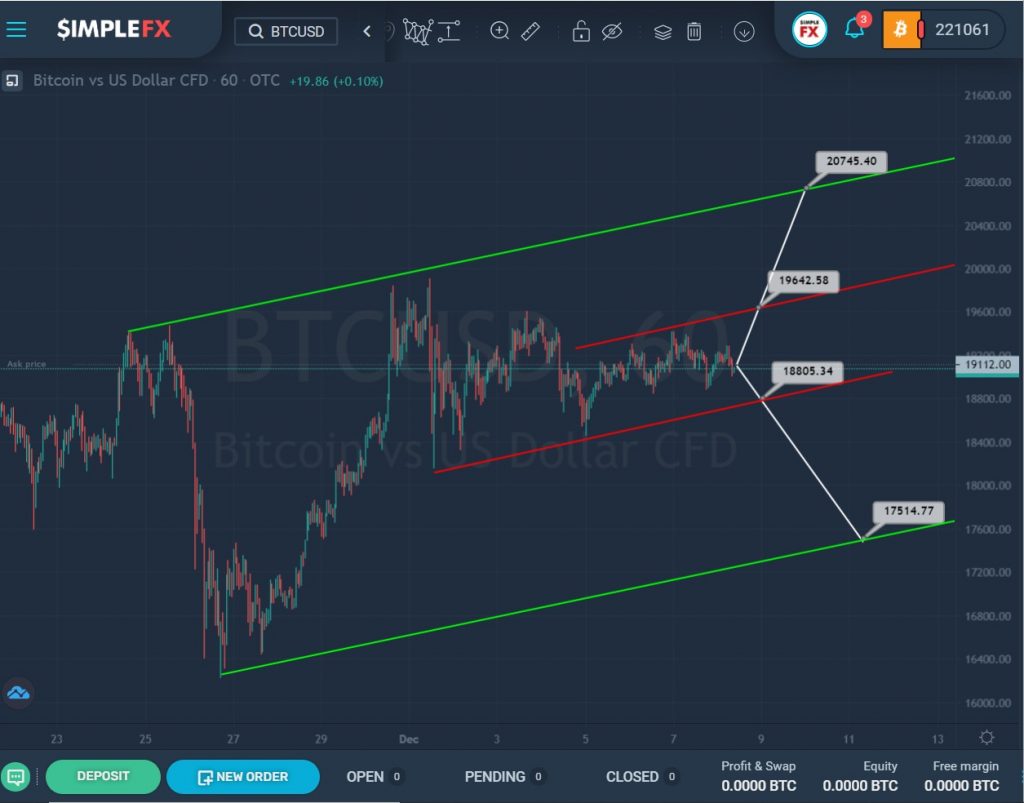
The current BTCUSD structure shows an uptrend that moves within a large green channel. Not so long ago, the price rose rapidly from the lower line to the upper line of this channel.
Currently, the market is moving horizontally, approximately in the center of the green channel. This section describes a small red channel.
When the resistance level of 19642.58 is reached and then broken, which is on the upper red wall, market participants can expect the price to increase to the higher resistance level of 20745.40, located on the upper green line.
However, it is possible that the market will move in a downward direction. If the price approaches the lower red line and can break through the support level of 18805.34, then the bears will open the way to the lower green wall and the support level of 17514.77.


