

The US mixed yesterday. Dow Jones ended trading in the green despite a sharp drop of Pfizer after the company announced cuts to the predicted number of Covid-19 vaccine shots to be distributed in December.
Take a look at our DJI30 analysis. As for forex, we chose EURJPY today as it has entered an interesting period recently.
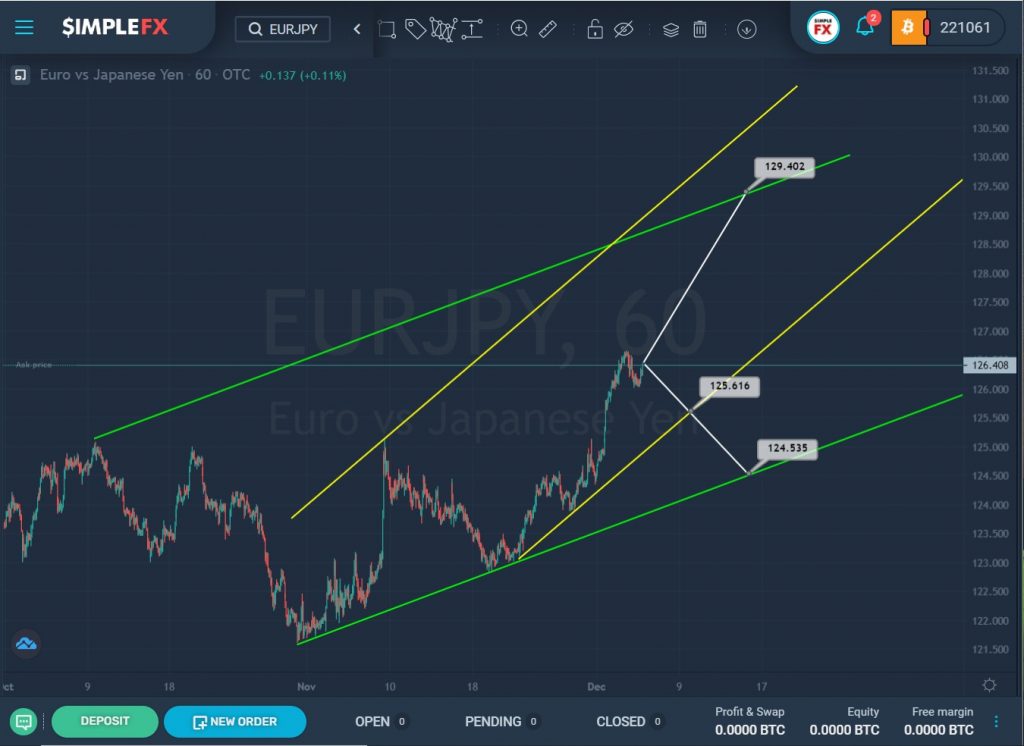
The structure of the currency pair shows the development of an uptrend that moves within two channels: yellow and green.
We saw the formation of the yellow channel after the last rebound of the price from the lower green wall, then the market began to move upward.
Perhaps the bulls have enough gas in the tank to push the price even higher. It is likely that the pair will reach the resistance level of 129.40, which is on the upper yellow wall.
However, if the market starts to decline and touches the lower green line, then, in the event of a break of the support level of 125.61, we could see the price fall to the lower support level of 124.53, which is on the lower wall of the yellow channel.
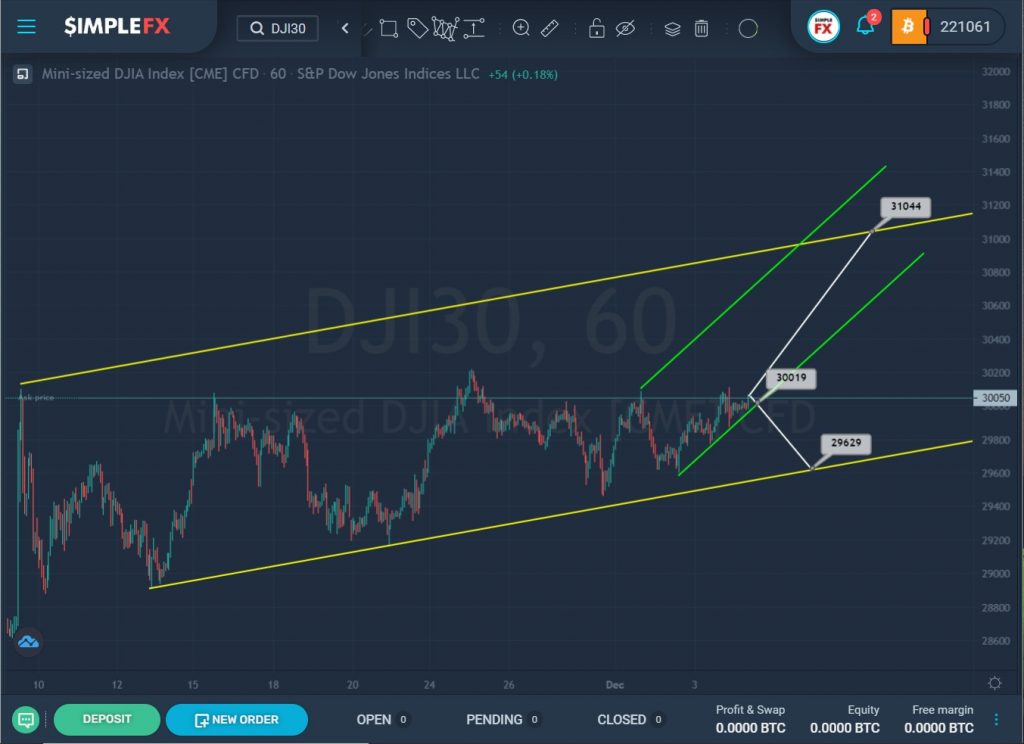
The current DJI30 structure hints at the formation of a bullish trend that is under construction inside the yellow channel.
For a long time, the price moved from the lower line of the yellow channel to its middle and then returned back again.
The last section of the chart describes a small ascending green channel. At the moment, the price is in the lower zone of this channel.
If the market breaks through the support level of 30019, which is on the lower line of the green channel, then the bears will have a clear path to the lower yellow wall and the support level of 29629.
The alternative scenario suggests that the bulls can take control of the market and start driving the price up. If the lower green line is not broken, we can see growth to the upper line of the yellow channel and the resistance level of 31044.