

The Turkish lira is one of our favorite forex pairs. The volatility is high and there’s plenty of trading opportunities waiting. The Turkish economy is very politicized. Recently the currency soared after the government’s decision to fire the head of the central bank. Let’s take a closer look at the USDTRY and see what may happen next.
Of course, another key asset everybody is watching closely is bitcoin. We also do BTCUSD technical analysis for you trying to figure out what may happen next.
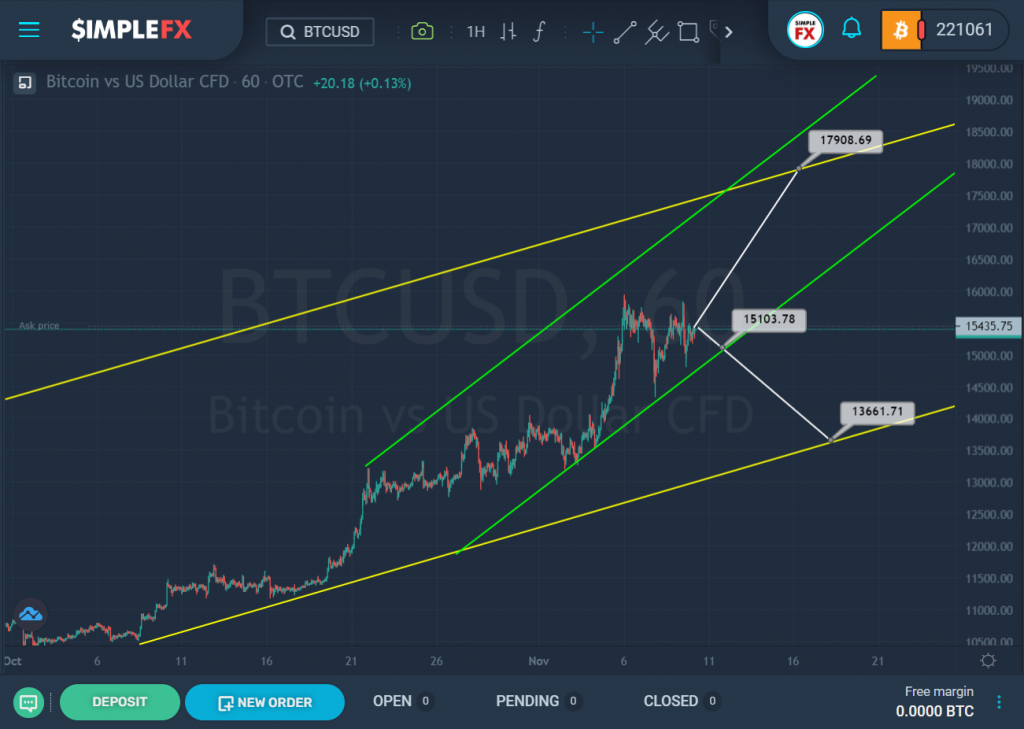
We see the 1H timeframe of the BTCUSD cryptocurrency pair. For a long time, the market moves inside the ascending yellow channel in a powerful bullish trend. The green channel describes price behavior more precisely.
We can assume that if the market continues to move inside the green channel, the bullish trend will continue. In this case, during the next trading week, we will see a price increase in the direction of the upper line of the green channel and the resistance level of 17908.69.
However, if the bears manage to move the price beyond the green channel and break down the support level of 15103.78, the decline will continue to the lower line of the green channel and support of 13661.71.
It is preferable to add this pair to our watchlist!
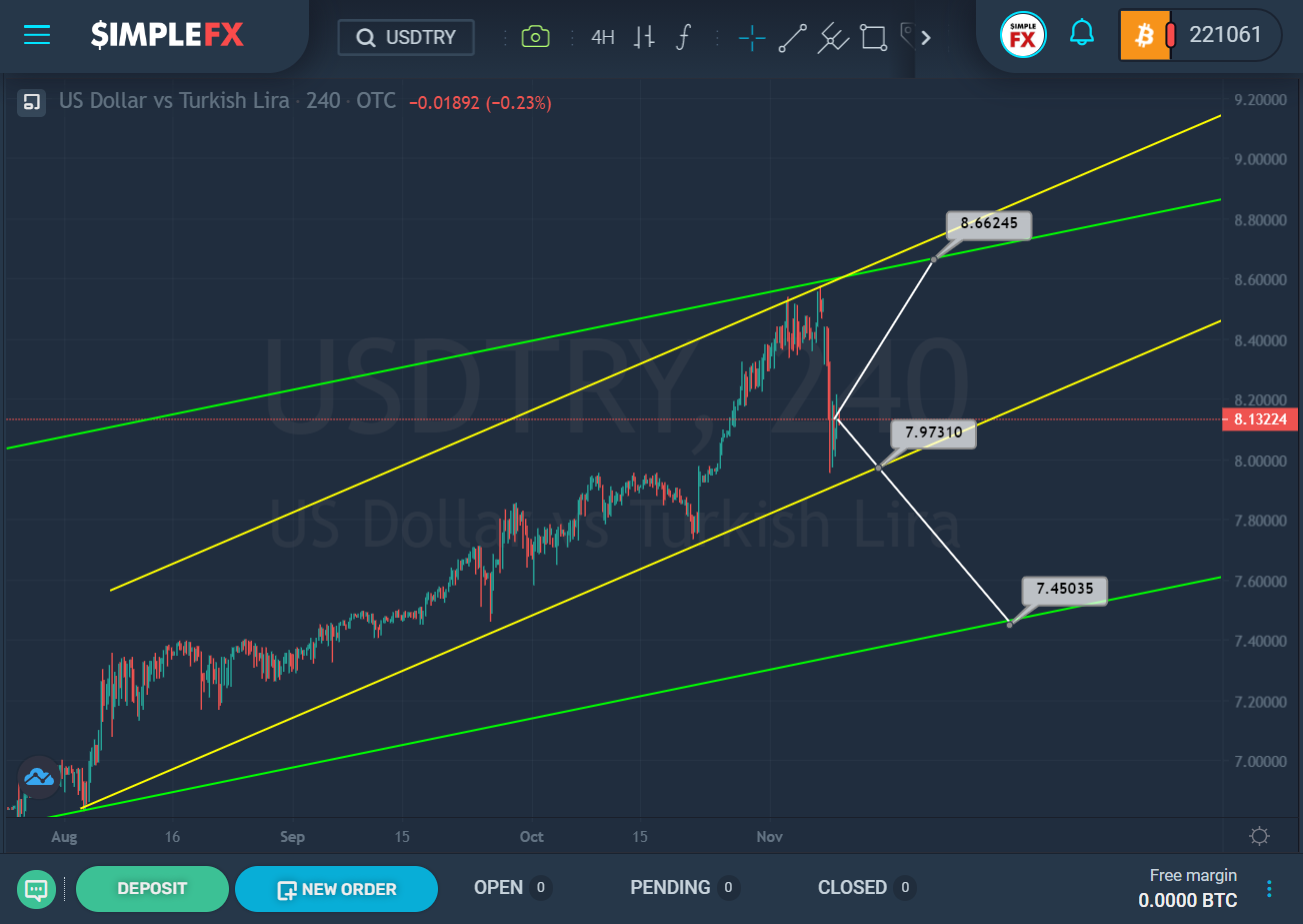
Here is the situation on the 4H timeframe for the USDTRY currency pair. The market moves inside two channels simultaneously in an upward direction. Several times the price rebounded from the lower line of the yellow channel, after which the bulls managed to reach the upper line of the green and yellow channels, then we saw a sharp decline.
If the decline continues and the bears will be able to get the price below the support level of 7.973 located on the lower yellow wall, it should be assumed that the market will continue to move down towards the lower line of the green channel and next support of 7.450.
However, if the support level is not broken, the bulls can expect growth in the direction of the upper line of the green channel and the resistance level of 8.662. An approximate scheme of possible future movement scenarios is shown on the chart.