

On the US Elections day, we take a closer look at the Japanese yen against the euro and the US dollar against the Swiss franc. Remember that ahead of the polls results the volatility may go through the roof at some markets. Sometimes it’s better to choose a more moderate asset to trade.
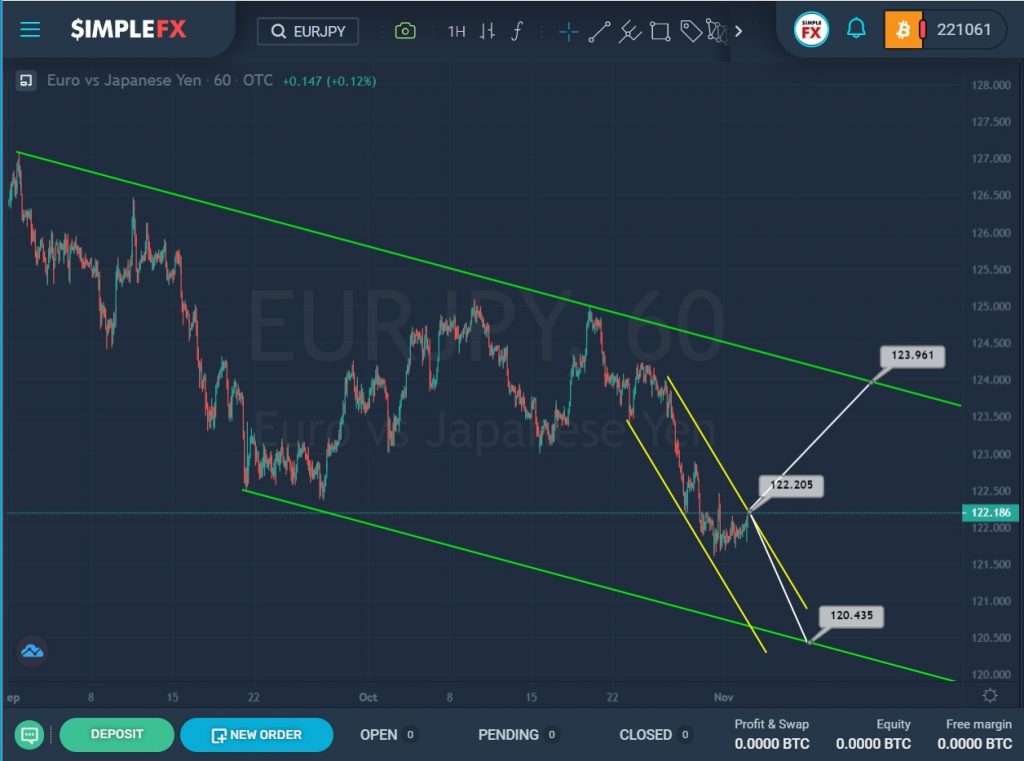
The EURJPY structure shows a powerful downtrend that moves inside a large green channel.
In the last section of the chart, we see that the price pushed off from the upper green line and began to rapidly descend. This section describes a small yellow channel.
The market is currently on the yellow channel resistance line, and if the bulls are strong enough, they can lead the market further in the upward direction, breaking through the level of 122.20, to the next resistance level of 123.96, which is on the upper green wall.
It is possible that the downward trend is not yet complete, so in the near future, we can see the currency pair continue to decline to the lower green wall and the support level of 120.43.
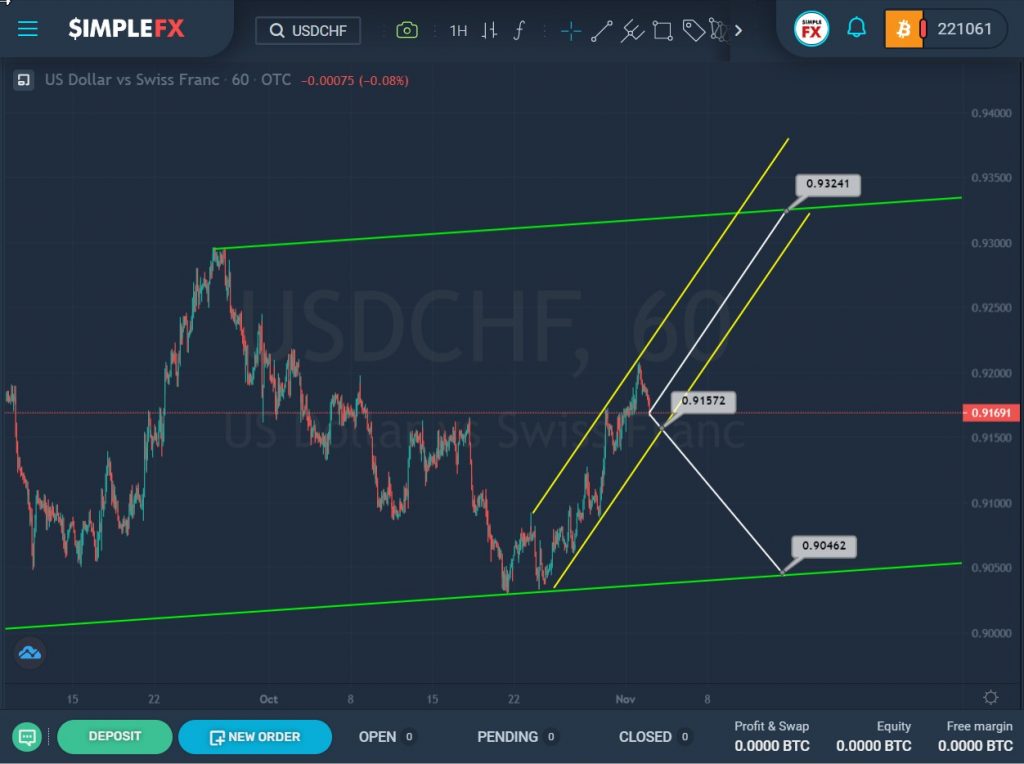
For USDCHF, we see the formation of an uptrend that moves inside the green channel.
Not so long ago, we saw a rebound in the price from the lower green line, after which the market began to move up. This gap describes a small yellow channel.
Currently, the price is in the center of the yellow channel, it can either go down or continue to grow.
If the market starts to decline and breaks the lower yellow line and the support level of 0.915, the price will continue to fall to the lower green line and the support level of 0.904.
However, if the price does not go beyond the yellow channel and does not break through its lower wall anywhere, then we can observe the continuation of the uptrend within this channel to the upper green line and the resistance level of 0.932.