


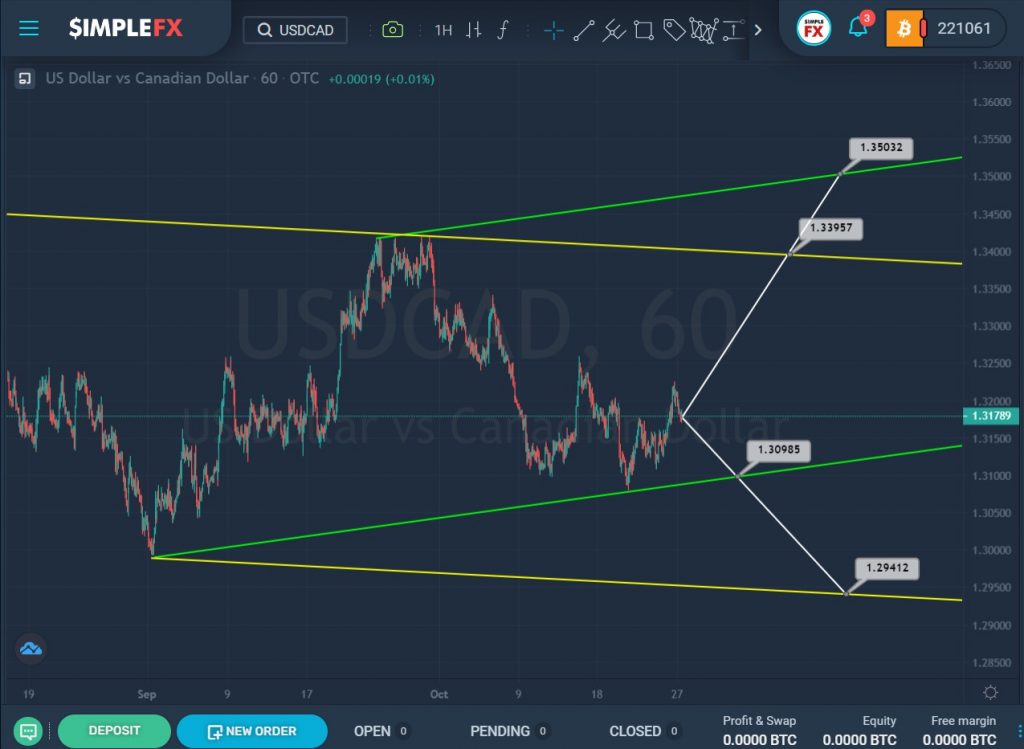
The current USDCAD structure shows a powerful trend that moves inside two channels: a descending yellow and an ascending green.
The second scenario considers a situation where the bears are not inferior to the bulls and continue to push the price down. If this assumption is confirmed, then in the near future we will see a decline in the price to the support level of 1.309, which is on the lower line of the green channel.
If the specified mark is broken, market participants can expect the currency pair to continue falling to the next important support level of 1.294, located on the lower yellow wall.

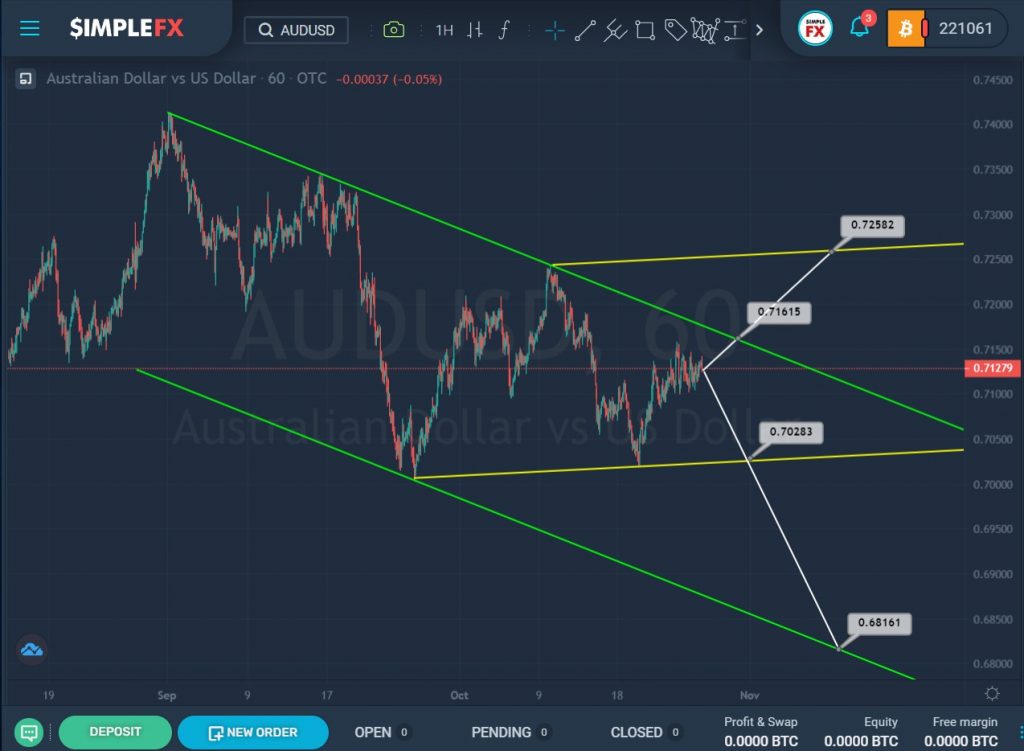
The AUDUSD currency pair has been moving inside the descending green channel for a long time.
After the last rebound from the upper wall of the green channel, the market started to go down, but when it reached the middle of the channel, it turned around again and continued its movement in the upward direction. This suggests that we are looking at the beginning of a new uptrend, which describes the yellow channel.
Thus, in the near future, we could see the price rise to the upper green line and the resistance level of 0.716, and in the event of its break, the price may continue to rise to the upper wall of the yellow channel and the resistance level of 0.725, which is on it.
However, there is a second scenario where we will see the continuation of the downtrend formation, in this case, the price is expected to decline to the support level of 0.702, located on the lower yellow line. Then, if the specified level is successfully broken, the decline may continue to lower levels. The next target will be the support level of 0.681, which is on the lower green wall.


