
Both the unstable political situation in the US and the recent outbreak of coronavirus in Europe affected the markets. As uncertainty rises, take a look at our technical analysis of SPX500 and USOIL – assets that are worth keeping a close look at this week.
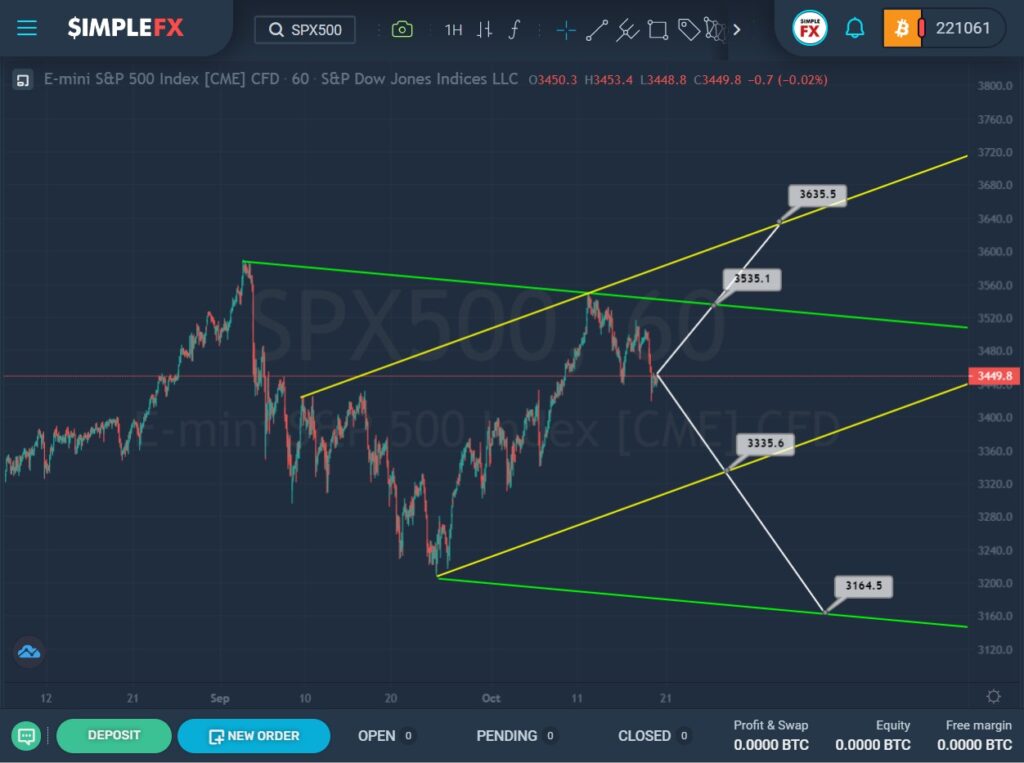
The current SPX500 structure shows the development of a trend that moves inside the green and yellow channels.
After rebounding from the upper green line, the price dropped to the lower lines of the yellow and green channels, then we saw the market increase to the intersection of the upper lines of these two channels, after which the market began to gradually decline.
If the bulls can gather strength and reach the resistance level of 3535.1, which is on the upper green wall, and then go above this price level, then the market may open a path towards the upper line of the yellow channel and the resistance level of 3635.5.
In the alternative, we expect a gradual and prolonged price decline. The initial target is on the lower line of the yellow channel – the support level of 3335.6. If this level is broken, the decline may continue to the lower support level of 3164.5, which is on the green line.
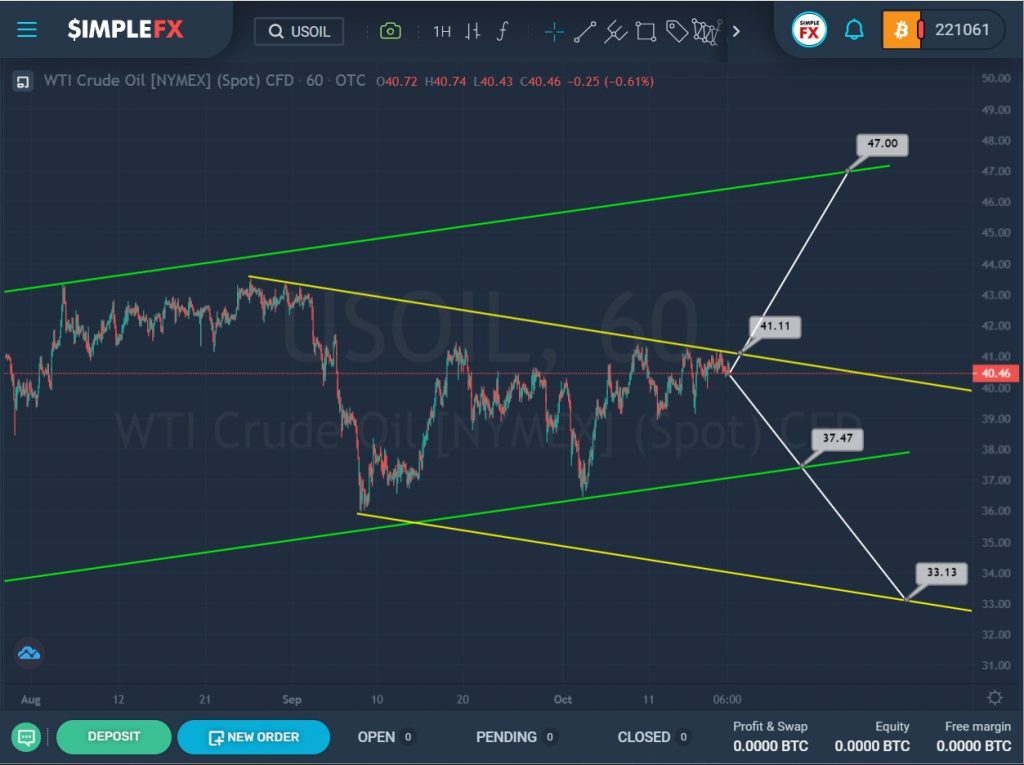
USOIL shows an uptrend that describes a large green channel.
Since the price has recently been moving around the lower zone of the green channel and does not rise above its middle, we can assume that the market has begun to form a new downtrend that describes the yellow channel.
If this hypothesis is correct, then in the near future we expect oil to devalue.
When the support level reaches 37.47, which is on the lower green line, and then when it breaks, we could see the market decline to the next important level of 33.13, which is on the lower line of the yellow channel.
However, if the bulls manage to go above the resistance level of 41.11, which is on the upper wall of the yellow channel, then we can see a continuation of price growth within the green channel to its upper wall and the resistance level of 47.00.