
Gold and pound sterling are the two assets we took a closer look at at the end of this week.
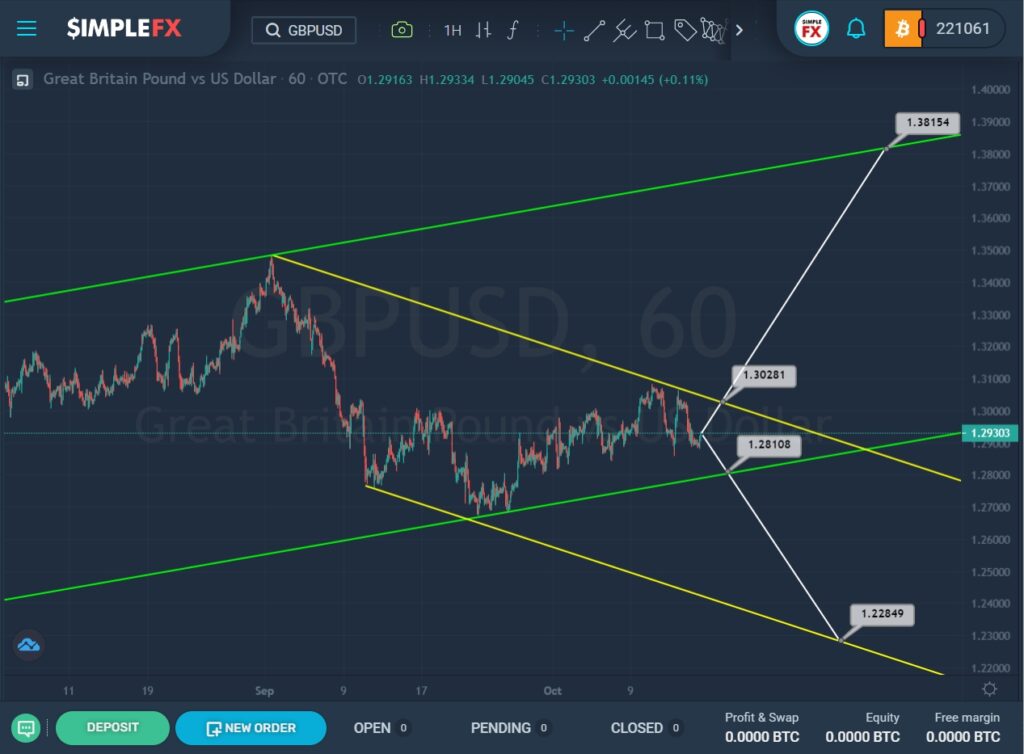
The current GBPUSD structure shows an uptrend that moves within a large green channel.
In September, we saw a rebound from the upper green line, and then the formation of a downtrend, which describes the yellow channel.
After the rebound, the price went down to the lower green wall, but could not break it. Currently, the market is near the top of the yellow wall and there is a possibility that the price will reach the resistance level of 1.302.
If the bulls will have enough power to push the market up, we may see the price rise and on to the next important level of 1.381, which is at the green line.
Alternatively, we can observe a price decline to the support level of 1.281, which is on the lower green line, and in case of breaking this level, the market will open the way to the bottom wall of the yellow channel and the support level of 1.228.
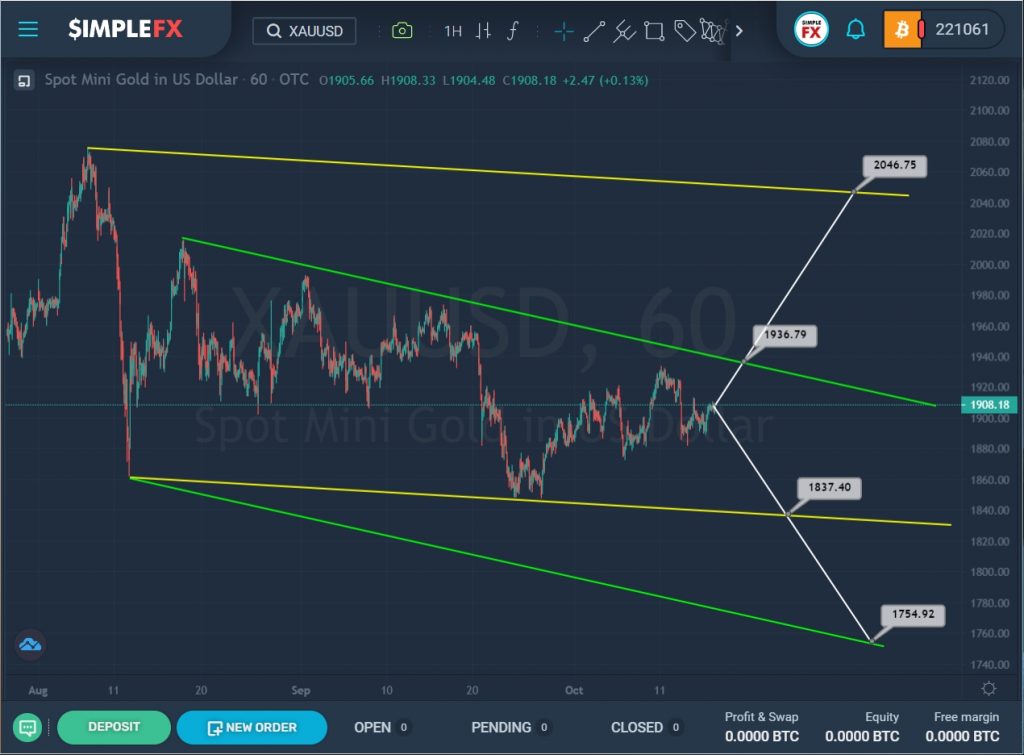
The XAUUSD structure shows a downtrend that moves within the yellow and green channels.
Not so long ago, we saw a smooth decline in the price from the upper green line to the lower yellow line, then the market turned around and began to move in an upward direction.
At the time of writing, we see that the price is in the upper zone of the green channel. It is possible that the increase in the price of gold will continue and reach the resistance level of 1936.79, and in the event of a break of this level, gold may reach a higher level of resistance, which is on the upper line of the yellow channel.
However, bears can take the initiative again and lead the market down. When the support level of 1837.40 is reached, which is on the lower line of the yellow channel, and then when it breaks, market participants could see a continuation of the price decline to the lower wall of the green channel and the support level of 1754.92.