

An impressive EURJPY rally created a great pattern for margin traders early this week. At the same time in the stock market prices went up after the US President Donald Trump left the hospital, where he spent some time diagnosed with COVID-10.
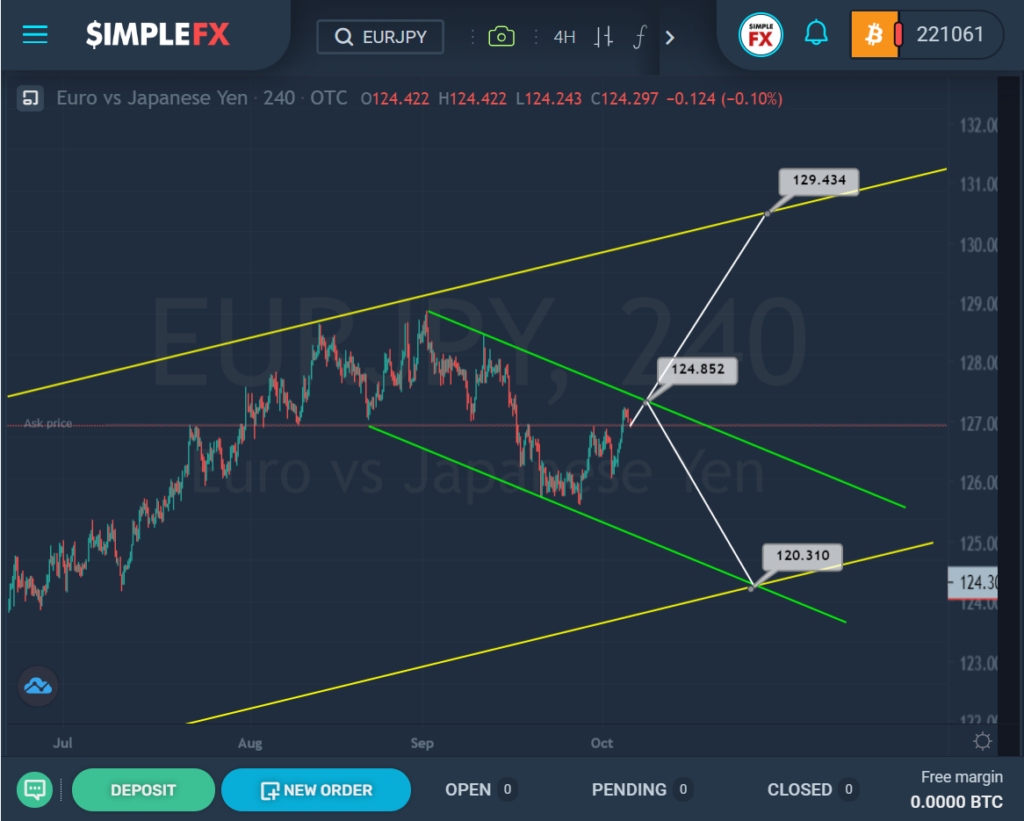
The current EURJPY structure hints at the construction of an uptrend that moves within a large yellow channel.
For a long time, the price gradually rose to the upper yellow wall, but did not break through it, we saw a rebound from the yellow line and the beginning of a decline.
More precisely, the current price behavior is described by a small green channel. The price reached its upper line several times, then went down to the lower line, and then went up again.
In the near future, the growth of the currency pair may continue to the resistance level of 124.85, located on the upper green wall. Then, when this level is broken, the pair will open a path to the upper yellow wall and the resistance level of 129.43.
If the scenario repeats and the bulls fail to break through the upper green level, then we can again see the price fall to the intersection of the green and yellow channel lines and the support level of 120.31.
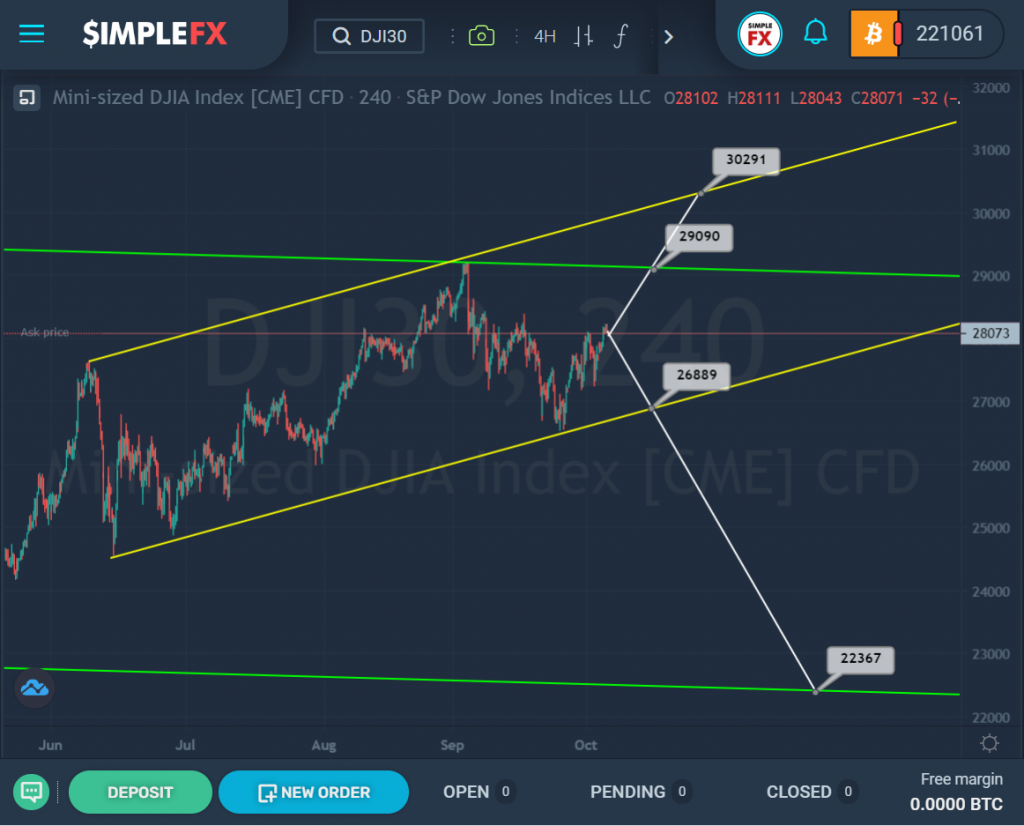
The structure of the DJI30 index shows an uptrend that moves inside the green and yellow channels.
Recently, we saw that the market touched the upper line of the green channel, then pushed off from it and headed down to the lower yellow wall. The bears failed to break through the yellow line, and the bulls led the market up.
There are two possible scenarios. In the first case, the price growth will continue to the resistance level of 29090, and if the bulls can break through it, the market will have a clear path to the upper yellow wall and the resistance level of 30291.
In the second option, we consider a scenario where the bulls give up their positions, and we can see the price fall to the lower line of the yellow channel and the support level of 26889. Then, if the specified mark is broken, the decline may continue to the lower green line and the next important support level of 22367.