


The US dollar is gaining ground along with Wall Street. Today we take a look at trading the greenback against its neighbor – the Canadian dollar. Take a look at our early-week analysis of two hot assets tradable on SimplefX – USDCAD, and NDX100. Make sure you keep an eye on these two.

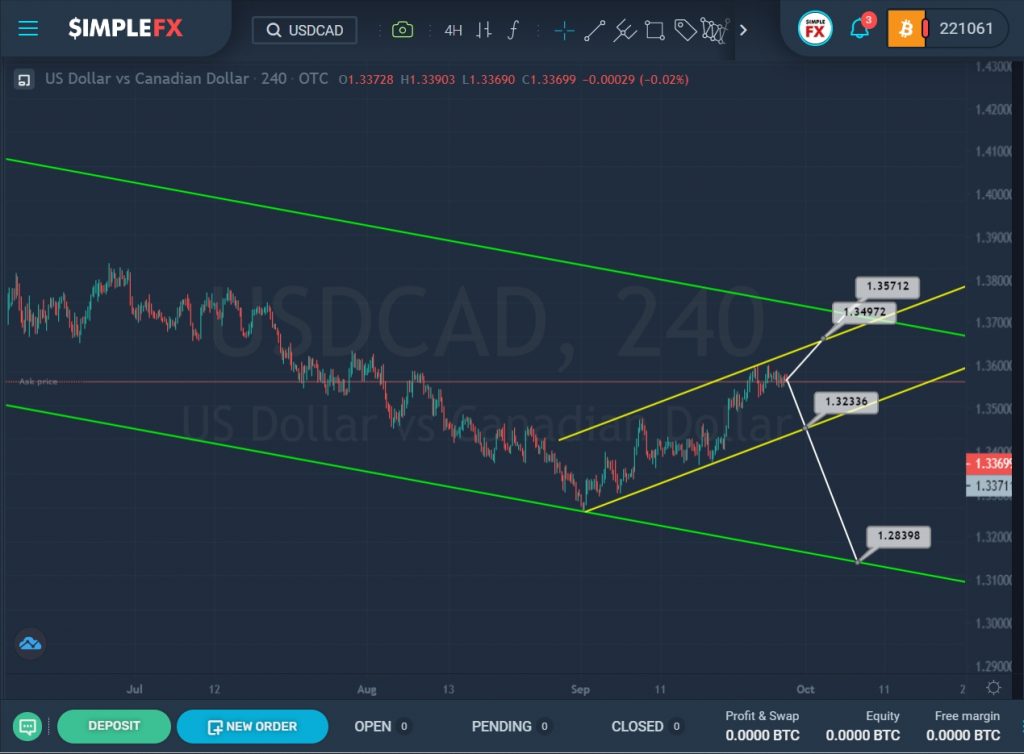
The current USDCAD structure shows a downtrend that moves inside the green channel.
Not so long ago, the price pushed off from the lower green line, and we saw the development of an uptrend that describes a small yellow channel.
Currently, the price is near the upper yellow line, so we can assume that in the near future the growth will continue to the resistance level of 1.349, located on the yellow upper wall. If the specified level is successfully broken, the market will open a path to the upper green line and the resistance level of 1.357.
However, there is another assumption.
Since the market has already approached the upper yellow wall several times, but failed to break through it, it is likely that the bulls do not have enough strength to push the market up, so the bears can take the initiative and lead the price in a downward direction. The first target is on the support line of the yellow channel – 1.323. If the bears can break through it, they will open the way to the lower green wall and the support level of 1.283.

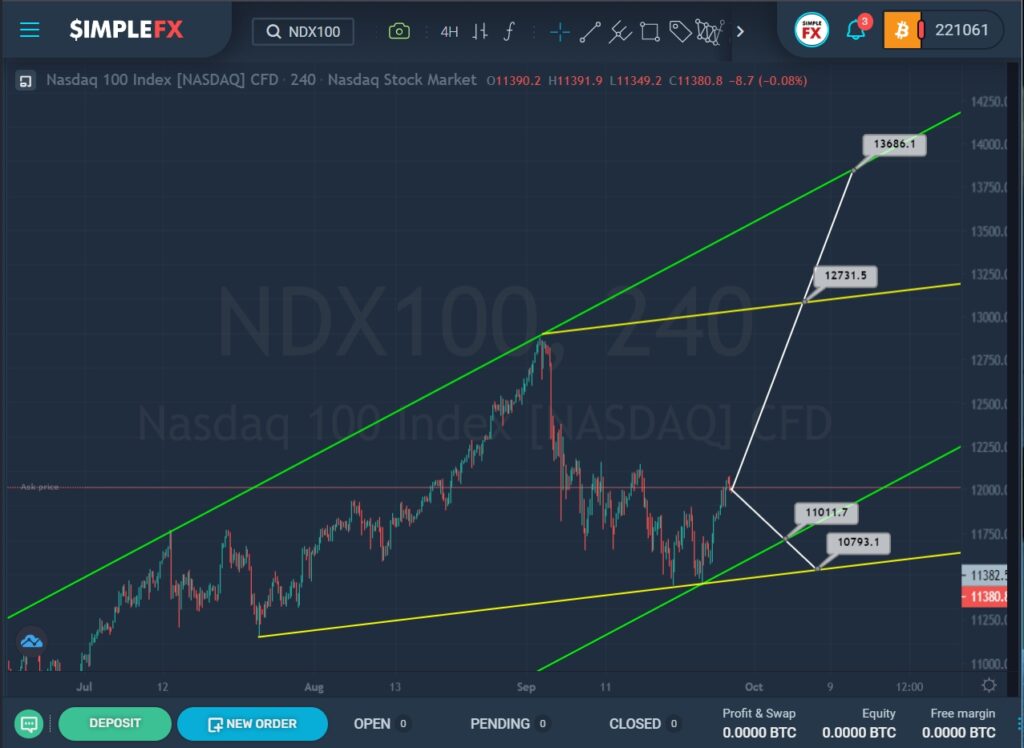
The current NDX100 formation hints that after the price touched the upper green wall again, the market started forming a yellow channel, which is approximately equal to the green channel in size. Then we saw a rapid decline in prices to the intersection of the lower walls of green and yellow channels.
It is possible that we are now seeing the initial part of the uptrend, so in the near future, the price is expected to rise to the resistance level of 12731, which is on the upper yellow line. Then, if this level is broken, the price may continue to rise to the next important level of 13686, located on the upper green wall.
Alternatively, the market is expected to decline again to the lower green line and the support level of 11011, then, in the event of a break of this level, the decline may continue further to the 10793 area, which is on the lower yellow wall.


