

Chainlink and USOIL – two assets from different worlds. But for our chart analysis trading strategy it makes no difference. At the beginning of this week these two symbols are the most exciting according to us. Add them to your watch list. Additionally, we have a special offer for all traders buying or selling LINK.
Make a LINK Depo or Trade LINKUSD to Win $1000!
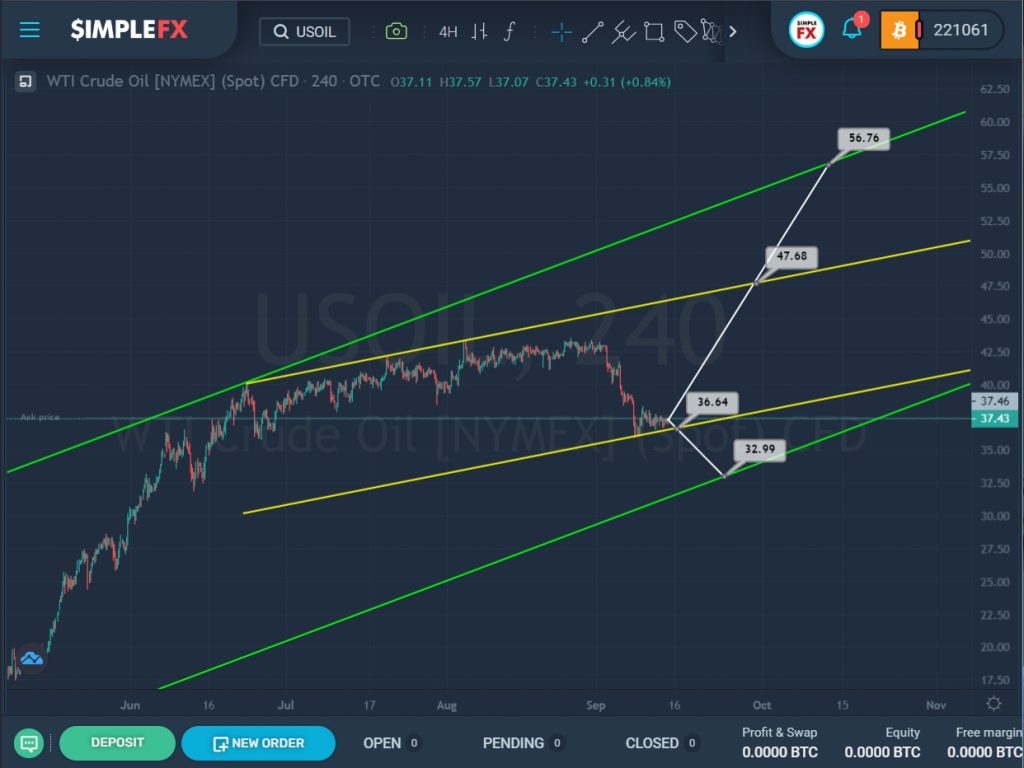
The current USOIL structure shows the formation of a large-scale uptrend that moves inside the green and yellow channels.
After the price rebound from the upper green and yellow walls, the market began to move smoothly in a sideways flat in the upper area of the yellow channel, after which we saw a sharp decline to the lower yellow line.
Currently, oil is near the support level of 36.64, at the break of which the bears will open the way to the lower green wall and the next important support level of 32.99.
Alternatively, if the bears do not have enough strength to lead the market further down, we can see a price reversal from the lower yellow line and its growth towards the level of 47.68, which is on the upper yellow wall. Then, in the event of a break above this resistance, the growth will continue to the upper green wall and the resistance level of 56.76.
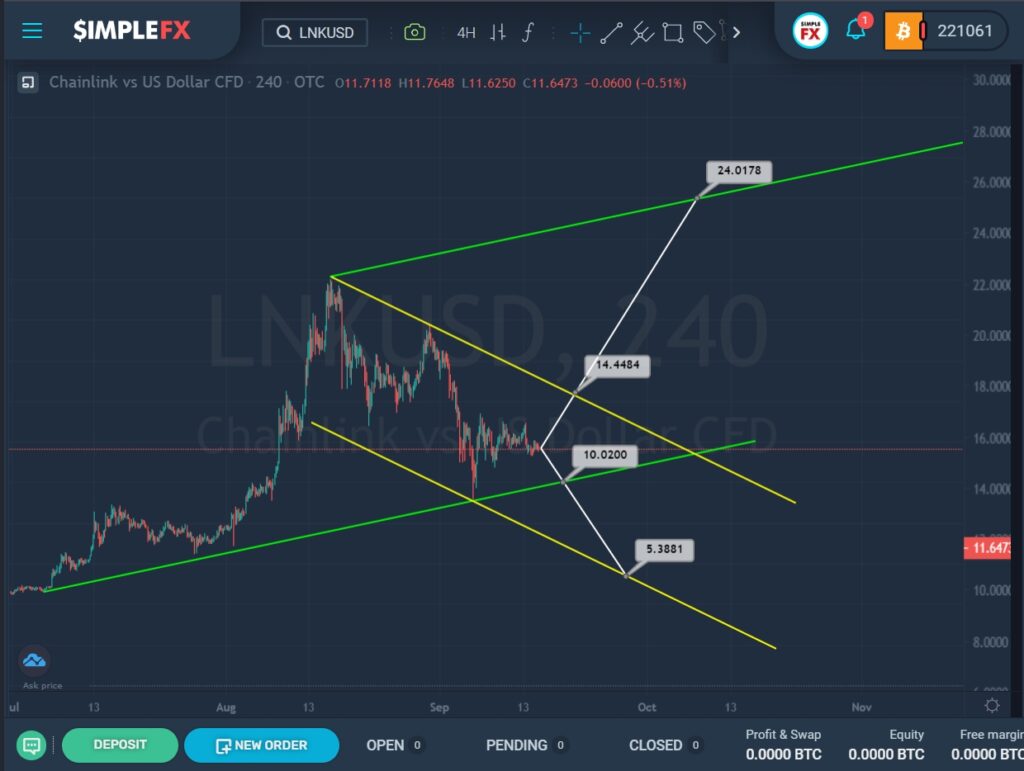
The LNKUSD structure shows that the market is currently moving within the ascending green channel.
However, after the price rebounded from the upper green line, we saw a downward movement of the market and the formation of a new yellow channel.
If the price decline continues and the bears can break through the support level of 10.02 located on the lower green line, LNKUSD may continue to move down to the next support level located on the lower yellow wall.
An alternative scenario is possible if the market moves upwards to the resistance level of 14.44, which is on the yellow wall. If this price level breaks, the bulls can continue to push the price up to the upper green wall and the resistance level of 24.01.