


Bitcoin falling below $10,000 for a while is the story of the week. On the forex markets, Turkish lira has hit a new historic low as the inflation rose to 11.77% in August. For SimpleFX both BTCUSD and USDTRY have been very profitable trading pairs. Make sure you watch them closely in the next days.
For a long time, the cryptocurrency pair moves inside the ascending yellow channel. Not so long ago, we saw a rebound in the price from its upper line.

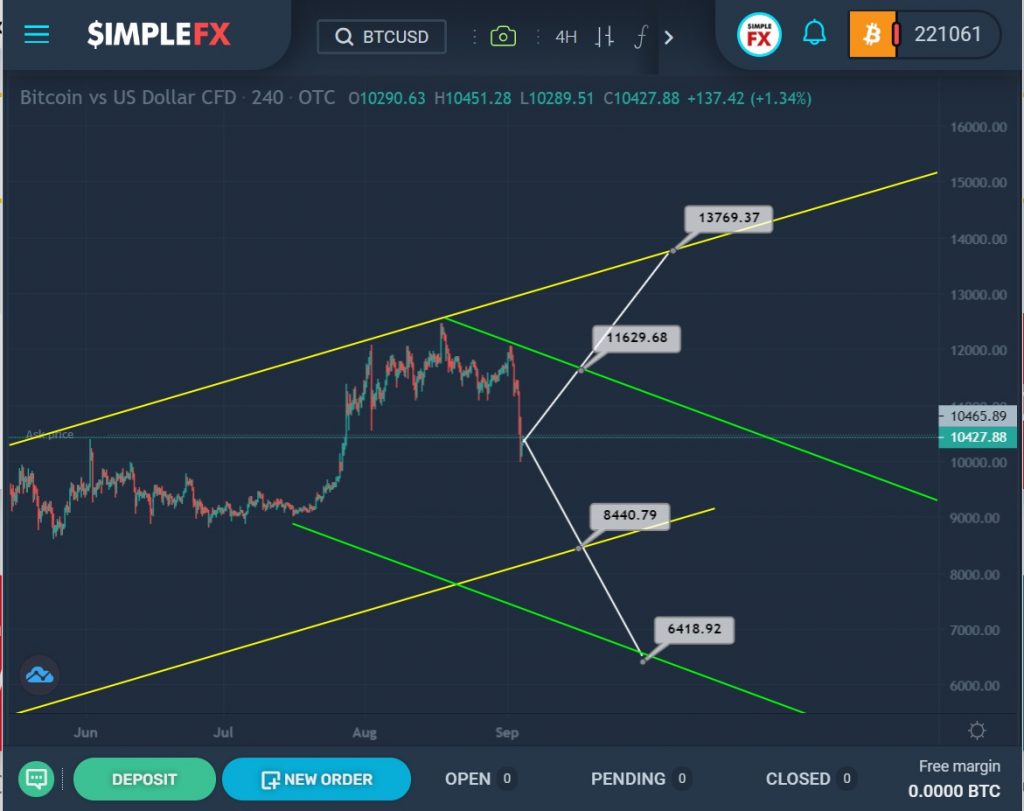
Since the market has been in the upper zone of the yellow channel for quite a long time, we can assume that a downtrend will develop within the green channel in the next coming trading weeks.
If the bears can reach the level of 8440, which is on the support line of the yellow wall, and then break through it, then the market will open the way to the lower green line and the support level of 6418.
However, there is a possibility that the bulls will continue to push the price up, and if they manage to break through the resistance level of 11629, which is on the green line, then there will be an opportunity for BTCUSD to rise to the 13769 area, that is, to the upper yellow wall.

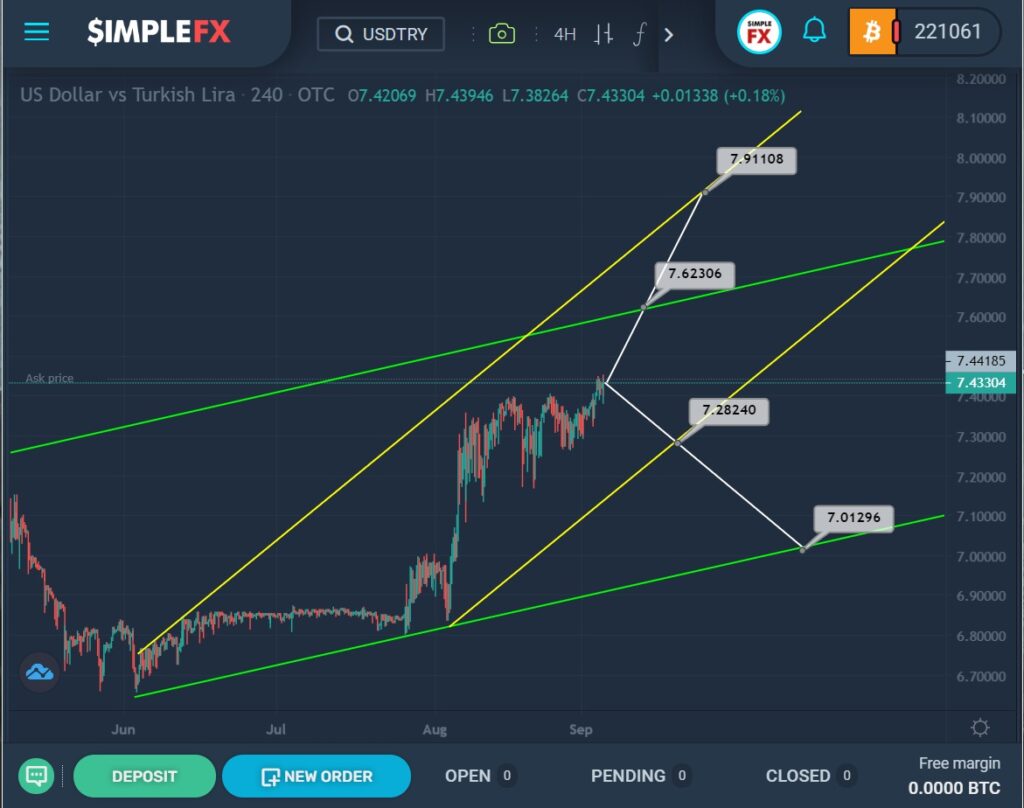
The USDTRY currency pair moves inside the yellow and green channels. Both channels are ascending.
Due to the fact that we have recently seen a fairly rapid uptrend that is heading towards the upper green wall, we can expect that, according to the main scenario, the growth will continue until the resistance level of 7.623 is reached.
If the bulls have enough strength to break through this price level, the growth will continue to the upper line of the yellow channel and the next important resistance level of 7.911, which is on the yellow wall.
In case of a quick reversal and a decline to the lower yellow wall and the support level of 7.282, the possibility of a break below this price level and a decline to 7.012 may open for bears. The level of 7.012 is on the lower line of the green channel.
The approximate scheme of possible future movement is shown on the chart.


