


In today’s SimpleFX analysis we take a closer look at the Dow Jones chart. While Nasdaq and S&P500 are breaking new highs almost every day, DJI30 is more stable. However, things may change when it breaks through.
The same is true for the very exciting forex pair GBPAUD. The Australian dollar is at the 5-week high against the pound sterling. Take a look at the charts

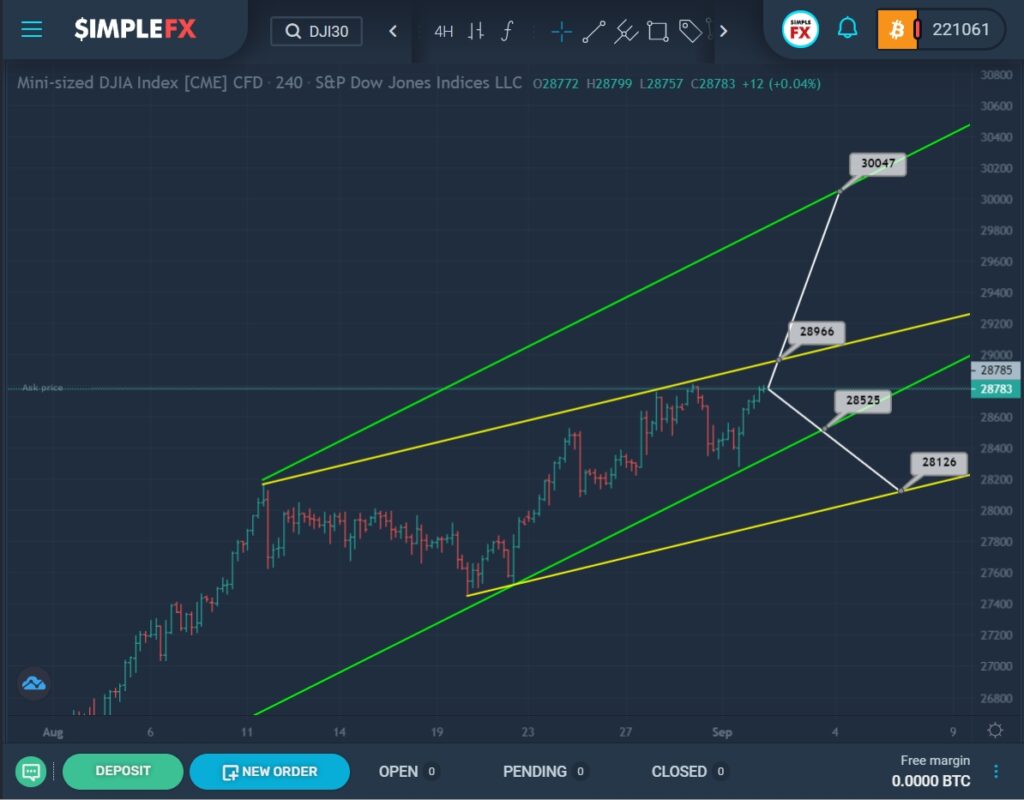
Currently, the DJI30 index moves between the upper yellow and lower green channel lines.
We see that after the rebound from the lower green and yellow walls, the market quickly grew to the level of the upper yellow line. Then the price bounced off it twice and went down to the green line, bouncing off it again. After that, the bulls headed to the 2896 area.
If the bulls can reach the level of 2896, which is on the upper yellow line, and breakthrough it, then they will open the way to the green wall and the resistance level of 3004.
There is also a possibility that in the near future the price will move down to the support level of 2852, located on the lower green line. If the specified level is broken, the price decline may continue to the yellow lower line and the support level of 2812.

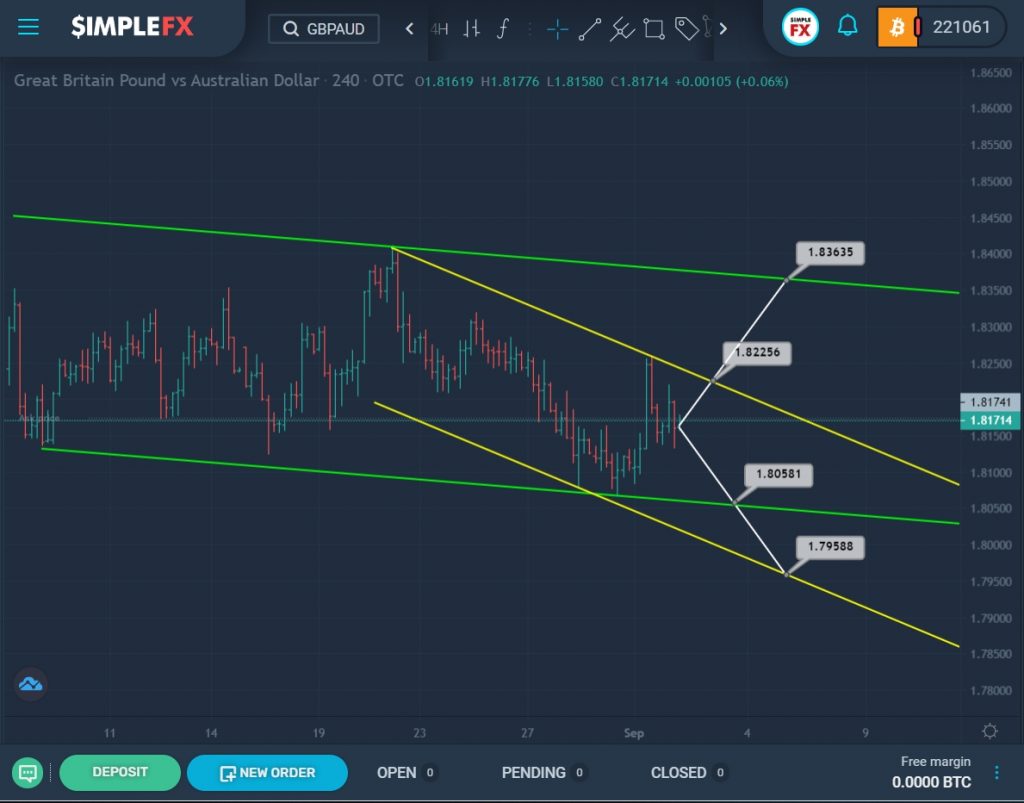
GBPAUD has been moving within a large green channel for a long time.
Not so long ago, after the rebound from the upper green line, we saw the formation of a new yellow channel, within which a downtrend is now being built.
If the market continues to move in a downward direction to the level of 1.808, which is on the support line of the lower wall, as well as in the event of a break of this level, the currency pair will open the way to the lower yellow line and to the support level of 1.795.
It is worth considering an alternative scenario, where the price rises to the yellow wall, and if the market breaks through the resistance level of 1.822, the price increase can be continued to the upper green line and the level of 1.836.


