


In today’s SimpleFX chart analysis we try to identify the trends for two of the most popular pairs among our forex traders: EURGBP and USDCHF. Make sure you keep a close eye on them.

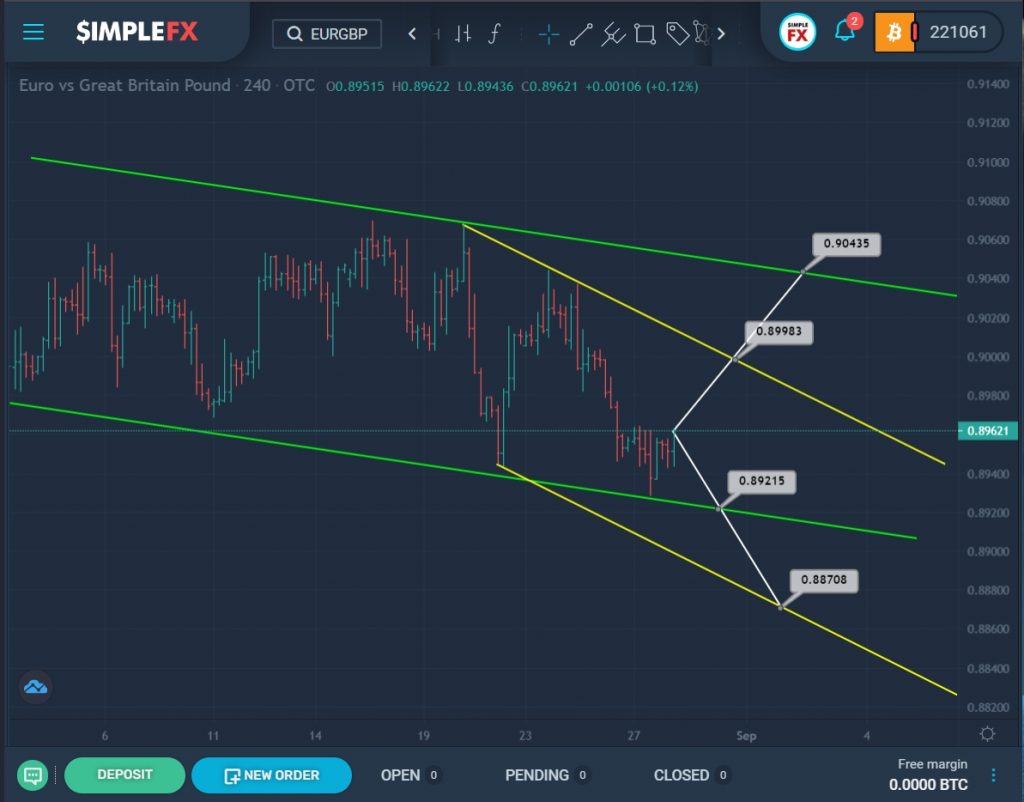
The current EURGBP structure shows that after the price rebounded from the upper line of the green channel, we saw the formation of a yellow channel and a smooth price decline in it.
At the time of writing, the price is in the center of the yellow channel. It is assumed that the market decline can be continued to the 0.892 area, which is on the support line of the green channel. If the bears have enough strength to break through this price level, then they will open a path to the lower line of the yellow channel and the support level of 0.887.
If the currency pair starts moving in an upward direction and breaks through the resistance level of 0.899, which is on the upper yellow wall, then in the near future we can see an increase in the price to the upper green line and the resistance level of 0.904.

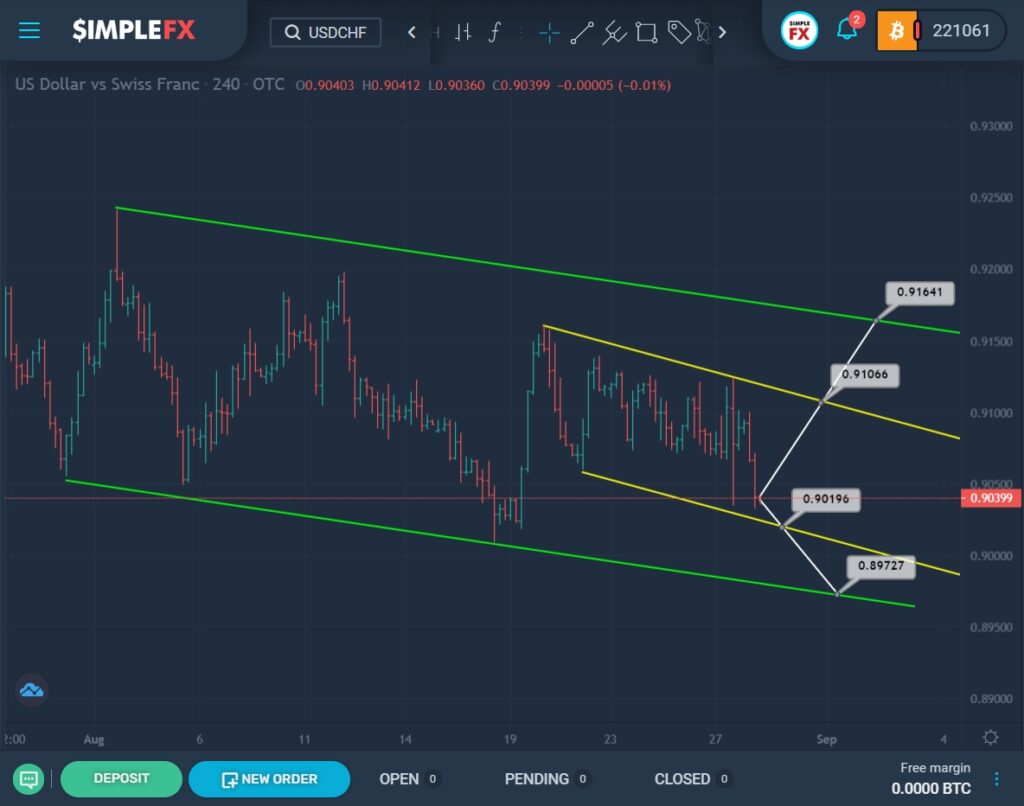
We see the formation of a downtrend that moves inside the green and yellow channels.
Now the market is in the lower zone of the yellow channel.
We could soon see the price reach the 0.901 mark located on the lower yellow wall. When this price level is broken, the USDCHF currency pair will open a path to the lower line of the green channel and the support level of 0.897.
It is possible that the bears are already weak, which means that the bulls can start pushing the price up towards the upper yellow wall and to the resistance level of 0.910. If this level is broken, the market participants will open a path to the upper green line and the level of 0.916 located on it.
It is preferable to add this pair on our watchlist!


