

Nasdaq is experiencing high volatility as two major stocks – Apple and Tesla – announced split this Friday.
On the other hand, we recommend adding USDCAD pair to your forex watchlist, as Canadian Dollar is on the rise, but this may change if the US Dollar continues to recover from the last weeks downfall.
Take a look at SimpleFX Tuesday techical outlook.
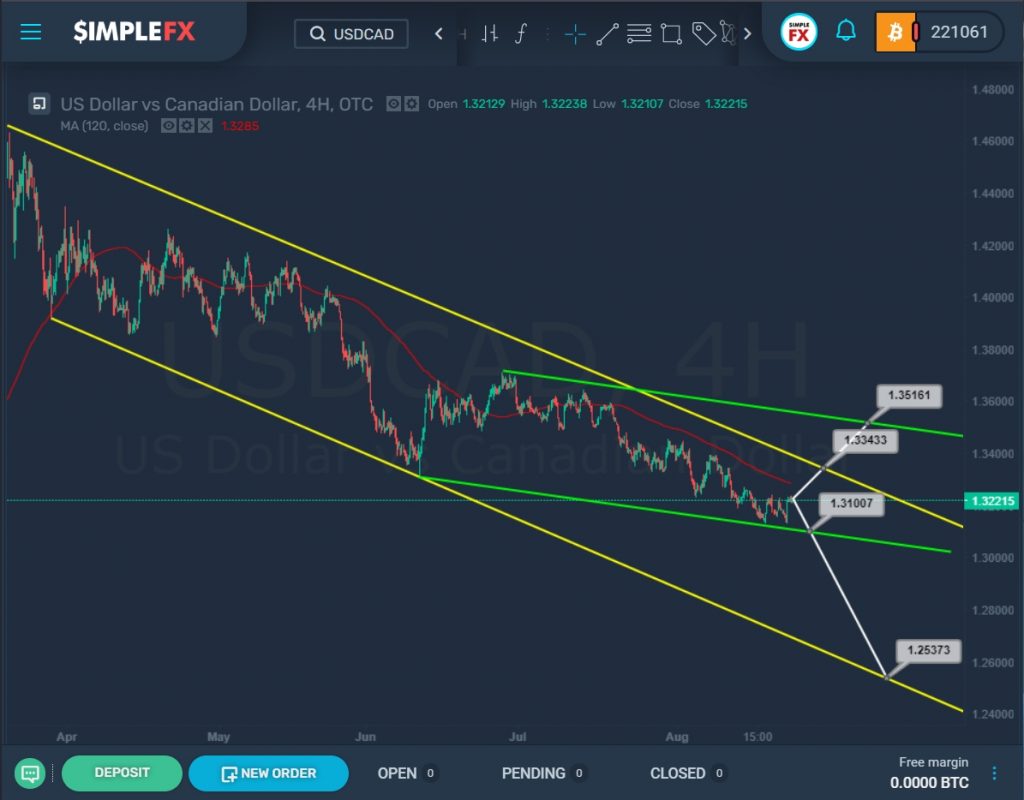
The current USDCAD structure shows that the market is forming a downtrend, which moves within the yellow channel.
In the last section of the price move, the green channel was also built. The price recently pushed off from its lower wall, so in the near future, the market may rise to the upper line of the yellow channel and the resistance level of 1.334. If the bulls have enough strength, and they will be able to break through this level, then they will open the way to the upper line of the green channel and the resistance level of 1.351.
However, it is worth considering the situation when the market will continue to move in a downward direction. In this scenario, the currency pair is expected to decline to the support level of 1.310, which is on the green line.
Then, when this level is broken, the price may continue to fall to the lower yellow wall and the support level of 1.253.
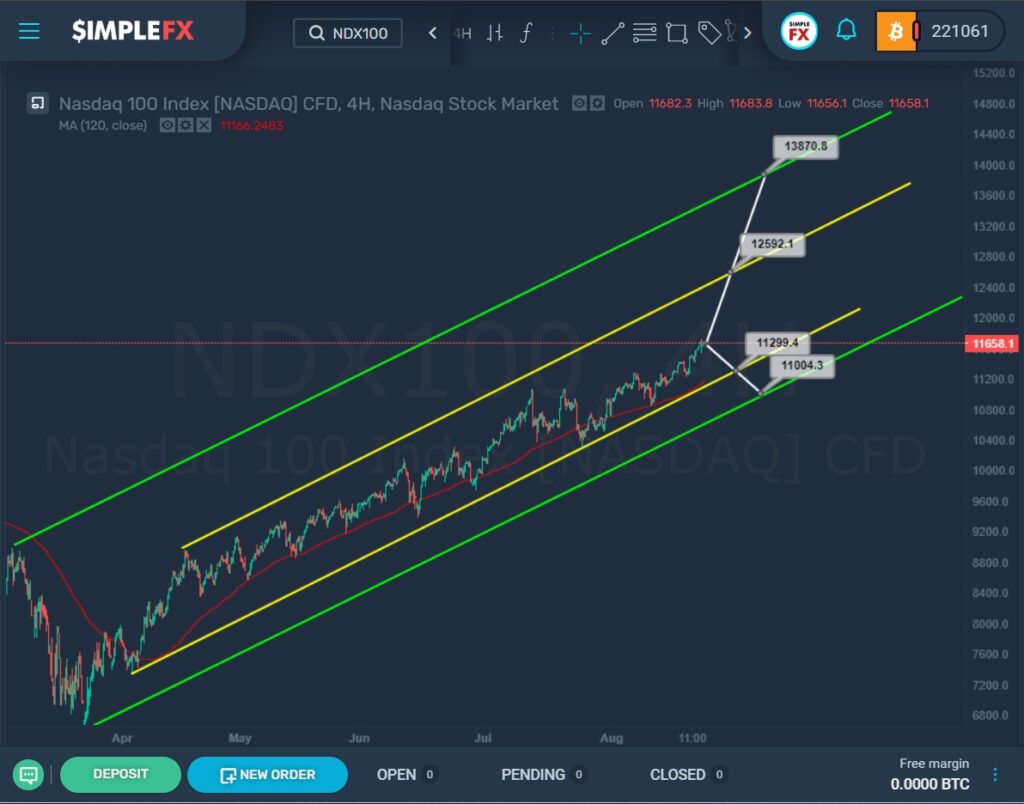
For a long time, NDX100 has been moving in an uptrend, which is inside the green and yellow channels.
The yellow channel describes price behavior more precisely. At the moment, the index is slightly closer to the yellow wall, so it is likely that in the near future the price will fall to the lower yellow line and the support level of 11299.4. If the bears manage to break through the specified level, the decline may continue to the lower line of the green channel and the support level of 11004.3.
The alternative option assumes that the bears will give way to the bulls, and we can see the market rise to 12592.1, which is on the yellow line. If this level is broken, the growth can be continued to the upper wall of the green channel and the resistance level of 13870.8.