
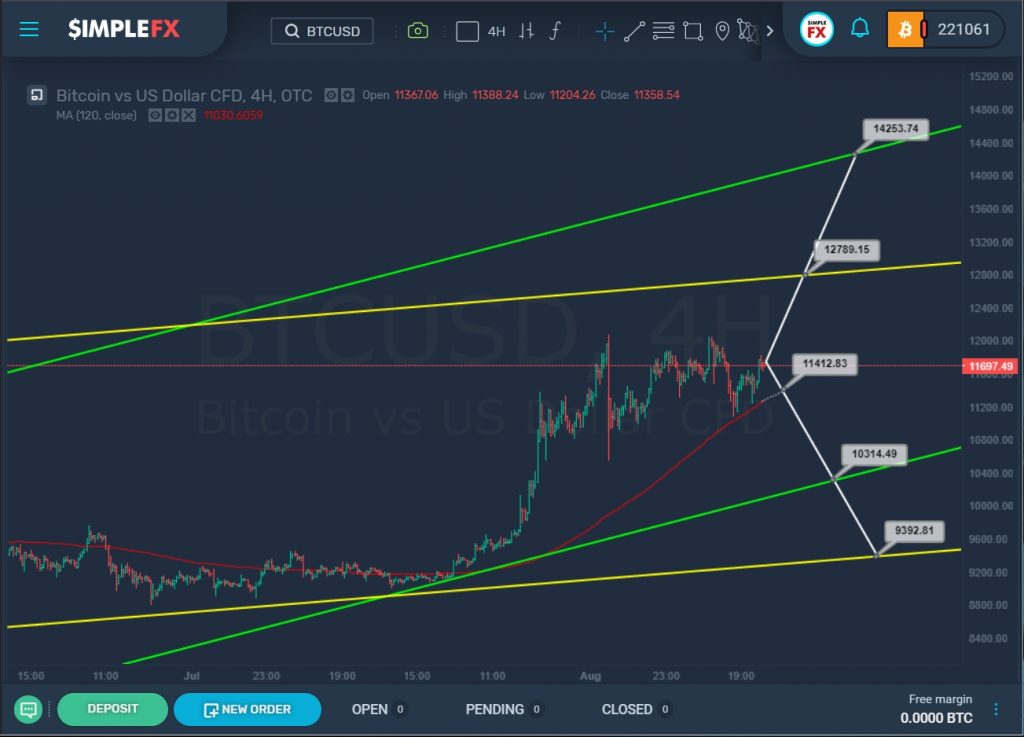
Currently, we see the development of a flat, which is formed inside the yellow and green channels.
Usually, after the end of a flat, the market continues to move in the same direction as it moved before it started. Thus, we can assume that in the near future we will see an increase in the price to the resistance level of 12789.15, which is on the upper line of the yellow channel.
If the bulls have enough strength to break through the specified level, the market will open a path to the upper line of the green channel and the resistance level of 14253.74.
But there is a chance that the bulls have lost their positions and the bears will lead the market down. If the red line of the moving average and the level 11412.83 are broken, the price will open a path in the direction of the support level of 10314.49, which is on the lower line of the green channel.
If the bears manage to break through this level, we could see the market move even lower to the lower wall of the yellow channel and the support level of 9392.81.
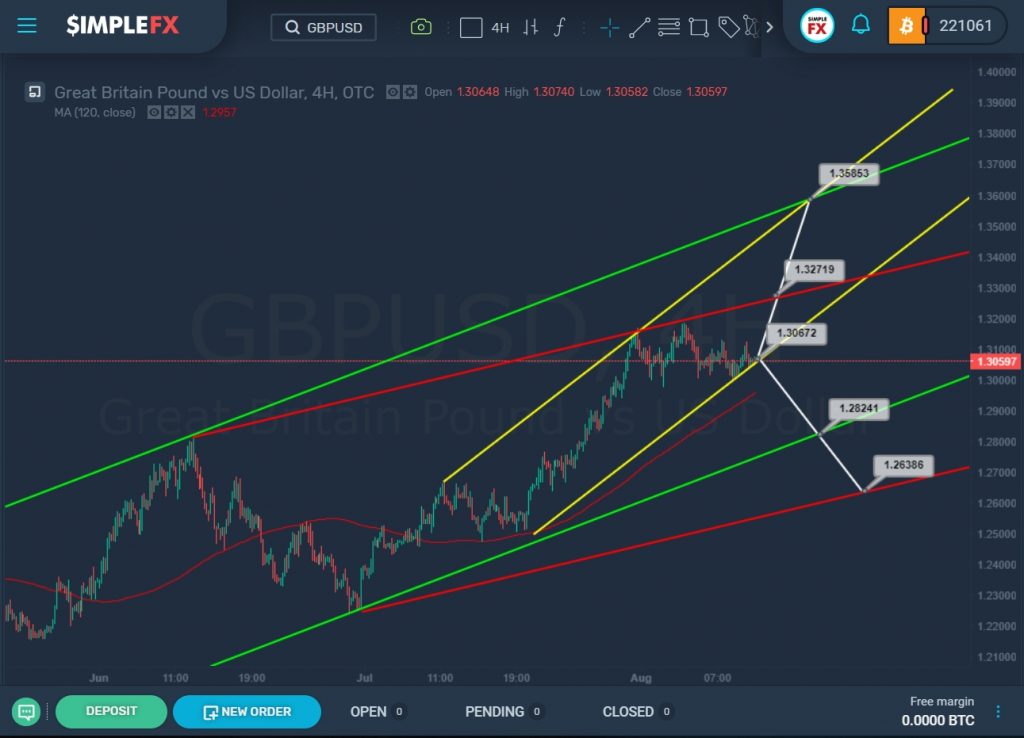
For the GBPUSD currency pair over the previous trading days, we saw a price move from the upper line of the yellow channel to its lower wall.
Now the price is right on the lower yellow line, which is the support line. If the bears put enough pressure and can break through the lower yellow line and the support level of 1.3067, then the way will open for them in the direction of the next important support level of 1.2824, which is on the lower green wall.
After that, if the downtrend continues and the price moves below the specified level, the bears can continue to push the price down to 1.2638, which is on the red wall.
The alternative scenario can be implemented if the market rebounds from the yellow line and support of 1.3067, in this case, we will see a smooth increase in the price to the red line and resistance of 1.3271.
If this level is broken, the growth may continue to the important intersection point of the upper lines of the yellow and green channels, i.e. up to 1.3585.