
Dow, SPX500, and Nasdaq made a rally yesterday. At the same time, gold set a new record of $2,069.21 per ounce. Take a look at our chart analysis before you make your today’s orders.
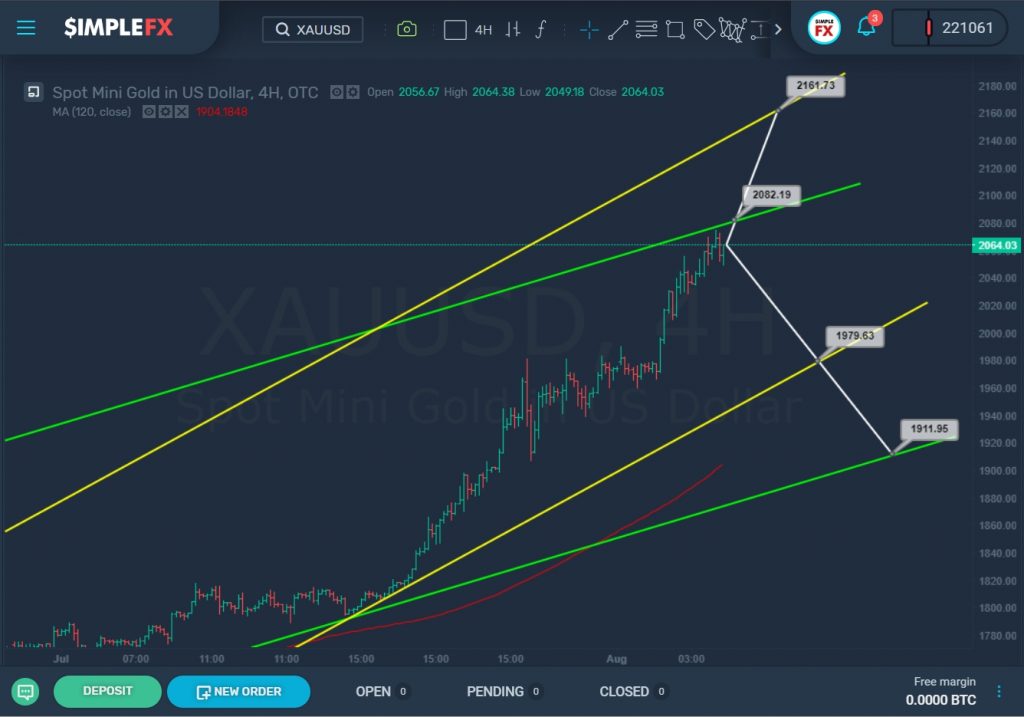
The current XAUUSD structure indicates that the market is approaching the upper line of the green channel and, most likely, the resistance level of 2082.19 will be reached in the near future.
If the bulls can break through the specified level, they will open a path to the upper line of the yellow channel and the resistance level of 2161.73.
It is possible that the price may start moving down to the support level of 1979.63, which is on the lower line of the yellow channel. If this price level is broken, the bears can continue to move in a downward direction to the 1911.95 area, that is, to the lower line of the green channel.
Since the market has already touched the upper green line, it will become clear which option the price will choose very soon. We expect either a break or a sharp decline in the near future. We will continue to monitor this pair in the future.
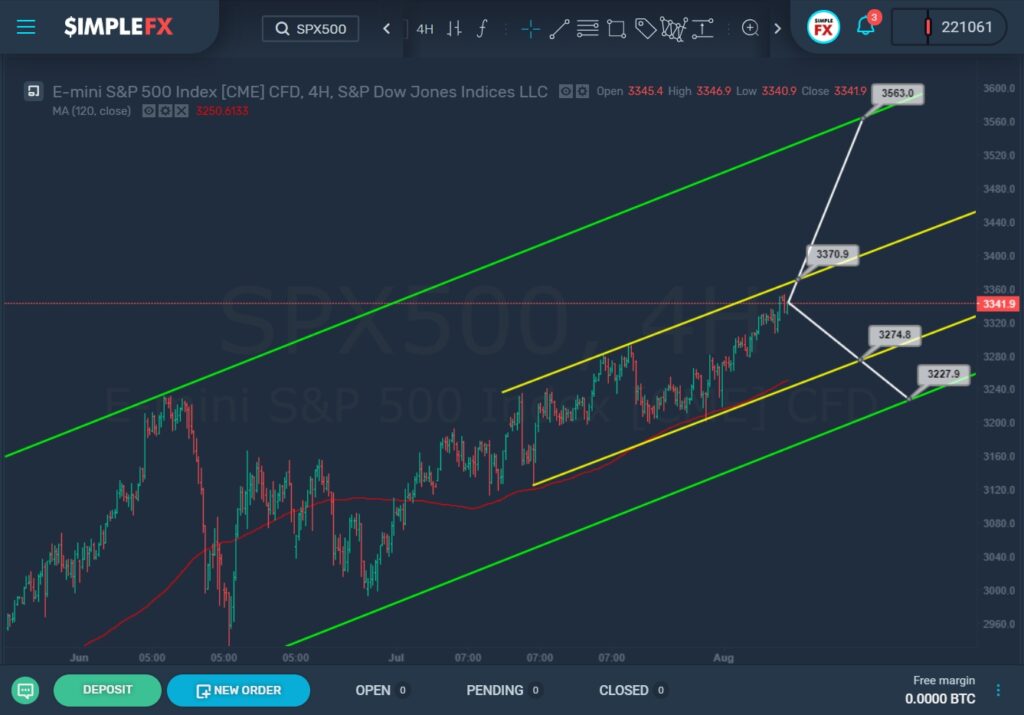
SPX500 is forming an uptrend that is inside the green and yellow channels. The market has almost reached the upper line of the yellow channel and the resistance level of 3370.9.
In the current situation, we can expect that bulls will break this level and price will continue to increase towards the next resistance level 3563.0 which is on the upper line of the green channel.
In case the bulls will be weakened in their place come the bears. Then we can see a decline to the support level of 3274.8, located on the lower line of the yellow channel.
Having gained enough strength, the bears can break through this line and head to the lower line of the green channel and the support level of 3227.9
An approximate scheme of possible future movement is shown on the chart.