

These are the two currencies that have always been treated as safe havens, and it seems their role can be even strengthened if investors turn away from USD or Euro.
SimpleFX USDCHF Chart Analysis: July 28, 2020
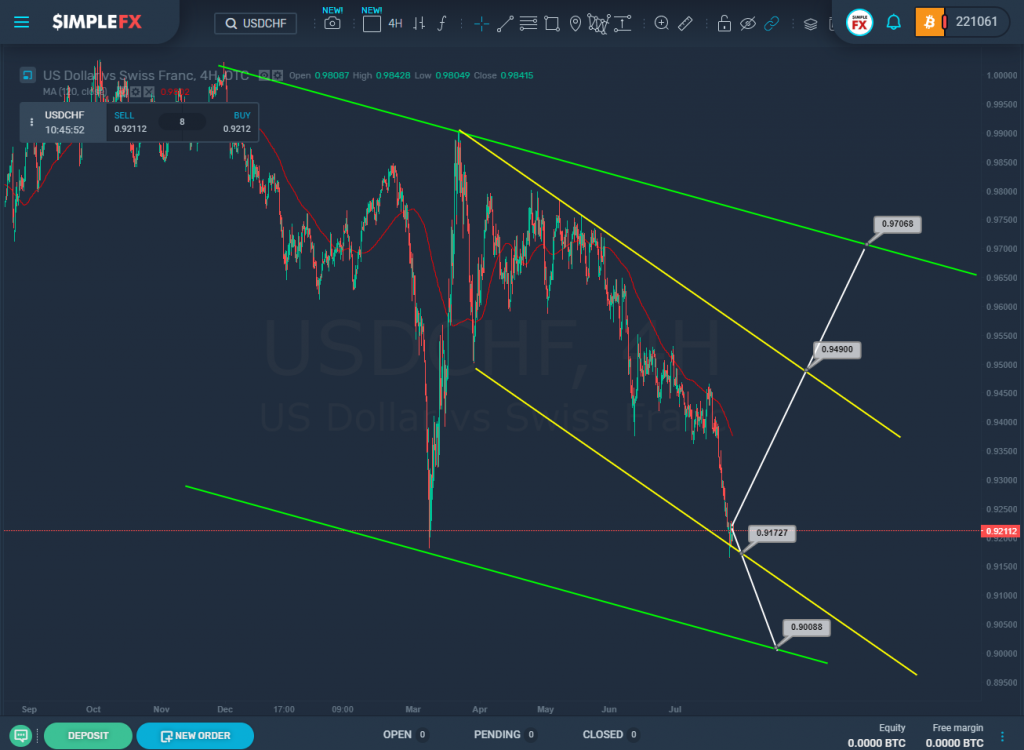
The USDCHF currency pair moves in a downward direction inside a large green channel from its upper line to the lower wall. The bounds of the yellow channel describe the price behavior more precisely.
At the moment, the price came close to the lower line of the yellow channel and even briefly pierced it, returning inside the channel. If in the near future we see a continuation of the decline, and the market goes below the price level of 0.917, which is the support level and is on the lower yellow wall, then the way will be open for the bears to the next important price support level of 0.900. This level is on the line of the green channel.
The alternative scenario is possible if the market pushes off from the lower yellow line and starts moving up towards the upper line of the yellow channel and the resistance level of 0.949. Further, if this level is broken, we can see the price rise to the resistance of 0.970, which is on the upper green wall.
SimpleFX EURJPY Chart Analysis: July 28, 2020
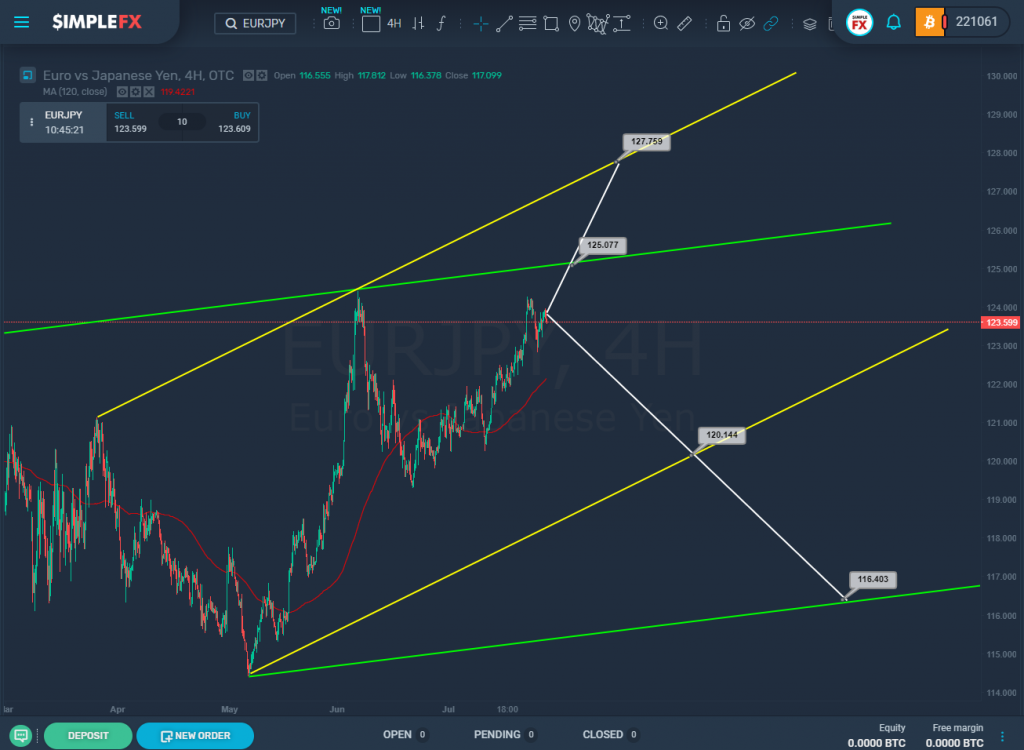
The current EURJPY structure indicates that the market is approaching the upper line of the green channel and will most likely soon reach the resistance level of 125.07.
A rise in the price to this level will increase the risk of its break. If the bulls manage to break above the resistance of 125.07, the way to the upper line of the yellow channel and the resistance level of 127.75 will be opened for them.
In this situation, we should also consider an alternative scenario, according to which the market may start moving down in the near future. In this case, the bears will reach the lower yellow line and the support level of 120.14. Then, in the event of a break below this price level, the market may decline to 116.40, i.e. to the lower line of the green channel.
Schematically, both possible future movements are indicated on the chart.