


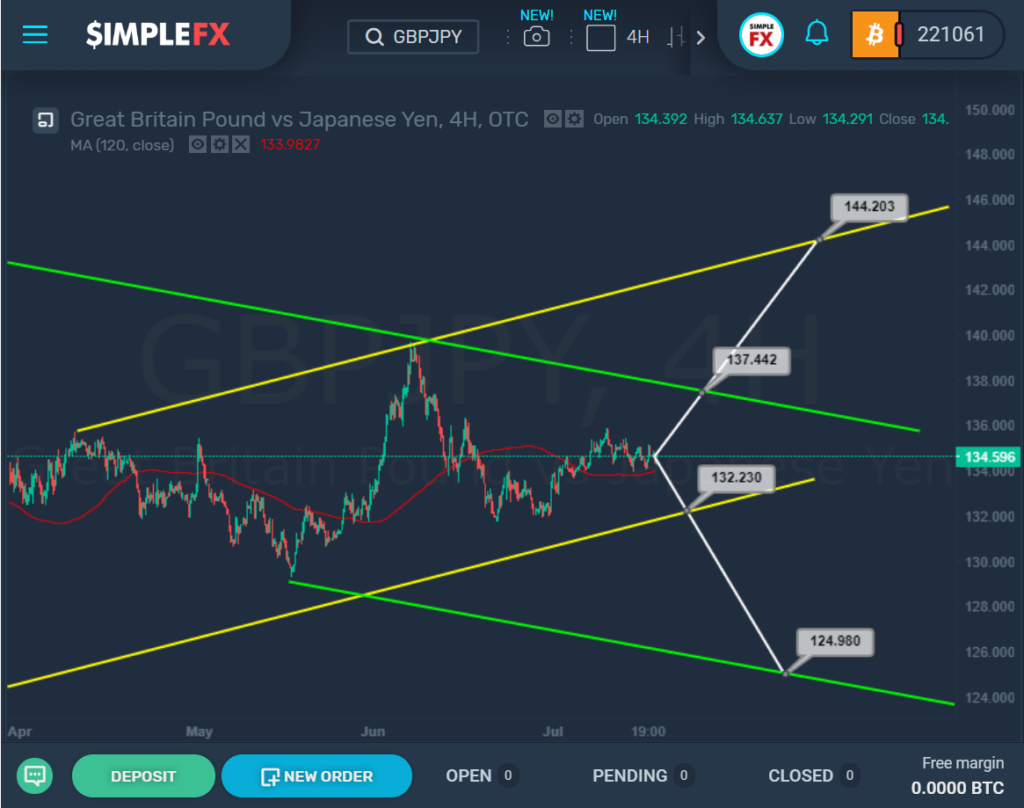
The current GBPJPY structure shows us that the market is moving inside the yellow and green channels, which are approximately the same in size.
Due to the fact that the price is now approximately centered between the upper green and lower yellow lines, we can see both a decline and a rise.
In case of a decline, the bears will reach the level of 132.23, which is on the lower line of the yellow channel. Then, when this price level is broken, the market will continue to move down in the direction of the lower green wall and the support level of 124.98.
The alternative scenario can be implemented if the price rises to the upper line of the yellow channel and the resistance of 137.44. In case of a break above this level, the growth will continue to the yellow wall and the next important resistance of 144.20.
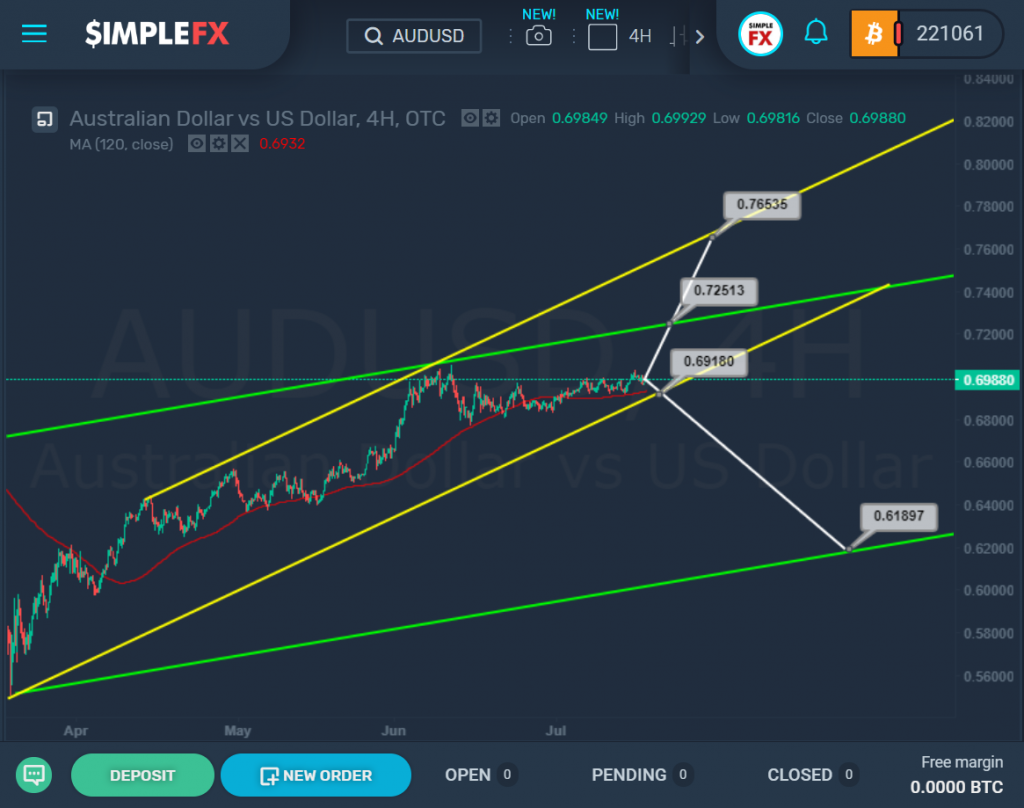
The market continues to move inside the small yellow and larger green channels.
Not so long ago, the currency pair pushed off from both the yellow and green lines, after that we saw the formation of a long flat, which almost reached the level of the lower yellow line.
If the yellow line is reached in the near future, and we see a decline to 0.691, and then a break of this price level, the way will be opened for bears in the direction of the lower line of the green channel and the support level of 0.618.
However, if the price rises above the level of 0.725, which is on the upper green wall, the market growth is likely to continue to 0.765. In other words, the market may again reach the upper line of the yellow channel.


