Close Menu
SimpleFX BlogSimpleFX Blog
    Facebook X (Twitter) Instagram
    Saturday, June 14
    Facebook X (Twitter) LinkedIn Telegram YouTube
    SimpleFX BlogSimpleFX Blog
    Banner
    • Home
    • News
    • Tutorials
    • Updates
    • Opinion
    • Trading Academy
    • Trading Schedule
    SimpleFX BlogSimpleFX Blog
    Home » Oil and Yen Among the Symbols with Huge Potential this Week
    Analysis

    Oil and Yen Among the Symbols with Huge Potential this Week

    Zach WrightBy Zach WrightJuly 14, 2020Updated:July 14, 2020No Comments2 Mins Read
    Facebook Twitter Pinterest LinkedIn Tumblr Email Telegram Copy Link
    SimpleFX USOIL Chart Analysis: July 14, 2020

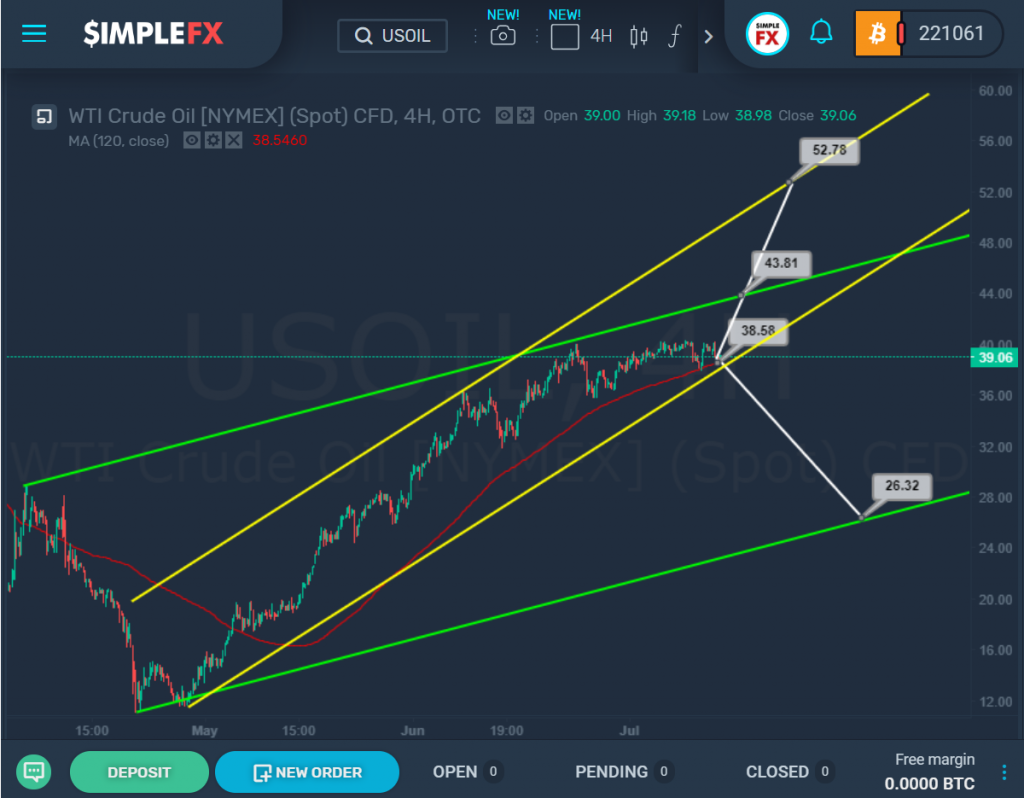
    The current USOIL structure suggests that the market is moving within the green and yellow ascending channels. After rebounding from the upper line of the green channel, the price moved in a flat to the lower line of the yellow channel.

    Now the market is right on the lower yellow wall, which is the support line for the price. If the level of 38.58 breaks down, the bears will open a path towards the lower line of the green channel and the support level of 26.32.

    An alternative option indicates that the market may push off from the lower yellow line and start moving up to the resistance level of 43.81, which is on the green wall.

    If this level is broken, the bulls will be able to grow to 52.78, i.e. to the upper line of the yellow channel. The approximate trajectory of a possible future movement is shown on the chart.

    SimpleFX  USDJPY Chart Analysis: July 14, 2020

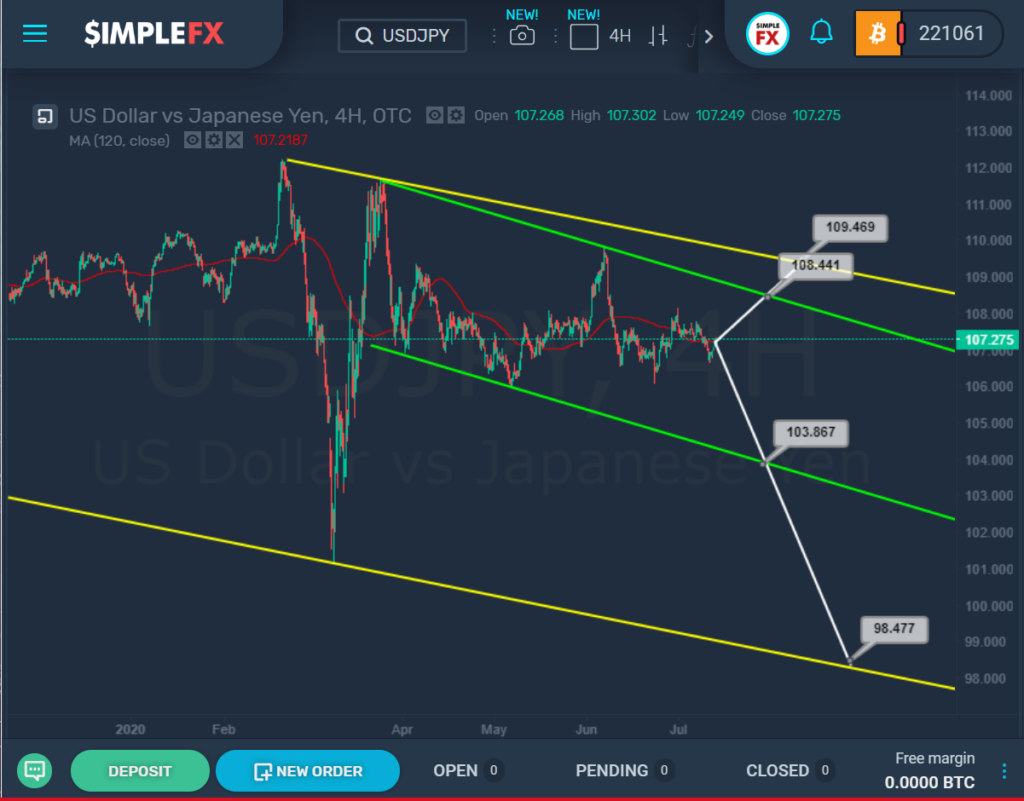
    On USDJPY, the market moves inside two channels directed downward. The green channel describes the price behavior more precisely since it is smaller in size.

    Not so long ago, the price pushed off from the lower green line and rose to the upper green wall. Then we saw a decline in the central zone of this channel. At the moment, it is not clear which line will be reached first, the support or resistance line.

    If the bulls continue to move up and reach the level of 108.44, then when it is breaking up, the rise will continue up to the top yellow line and the resistance level of 109.47.

    However, if we see a decline to the support of 103.86, and then a break of the lower green line down, then in the following trading weeks, a decline to the level of 98.47, which is on the lower yellow line, is possible.

    It is preferable to add this pair on our watchlist!

    featured forex oil
    Share. Facebook Twitter Pinterest LinkedIn Tumblr Email Telegram Copy Link
    Previous ArticleGold Climbing with Retracements, S&P Can’t Break Out Yet
    Next Article Trillions of Dollars and Zero-Interest Rates Pump Market Bubbles
    Zach Wright

    Related Posts

    New feature: Multicharts are live on SimpleFX!

    June 12, 2025

    Explore worldwide financial institutions in the Investment Arena!

    May 30, 2025

    Trade payment providers in the Investment Arena!

    May 21, 2025
    Leave Us a Review
    Review us on
    App Store
    Google Play
    Copyright © 2014 - 2025. 8Tech SVG Ltd (formerly SimpleFX Ltd) with registration number 22361 BC 2014 with registered address at Beachmont Business Centre, Suite 404, Kingstown VC0100, Saint Vincent and the Grenadines
    • SimpleFX WebTrader
    • Unilink Affiliate Tracker

    Type above and press Enter to search. Press Esc to cancel.