


Moving average is a simple analytic trading tool that every trader should learn. Some traders prefer to use moving averages as vital support or resistance. They base their buying and selling actions as they test the moving average line against the market.
In charts, moving averages help traders smooth out the price data by continuously updating the average price over a specified period. It filters our sudden price jumps to picture a more unobstructed view of the price movements. Unlike the traditional resistance and support lines, the moving average line is continuously changing based on the instrument’s recent price actions.
The critical applications of moving averages are:
- to filter out random price movements (false breaks)
- to identify trends and trend reversals
- to identify areas of support and resistance
- to spot profitable buy and sell timings

Avoiding False Breaks
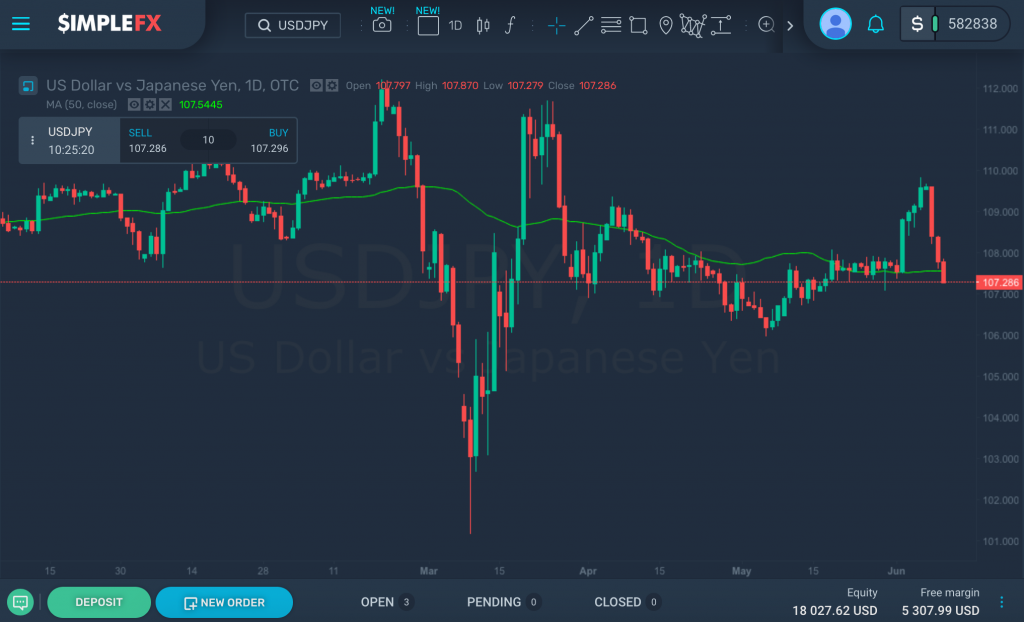
Price charts do not follow a single straight line. Prices can go up or down in short and long periods. In volatile markets, prices can dramatically rise or fall in an instant and can give false signals to traders, resulting in losses. Moving averages help traders avoid such mistakes by letting them focus on the average price instead.
The moving average price of an instrument is usually calculated based on its closing prices for a specified period. Some traders also use open prices, high prices, or low prices. For example, in a 50-day moving average, the closing prices of an instrument for the last 50 days are added, and the sum of which is divided by the period (in this case, 50 days).
For short-term traders, the most popular moving average time frames are 10–20 days. Take note that these are very sensitive to price changes. Mid-term term traders prefer a 50-day moving average, and long-term traders favor a 200-day moving average. There is no single correct time frame to use for your moving averages. It is best to learn and try out which one works best for your trading strategies.
Spotting Market Trends and Trend Reversals
Moving averages can easily show the trend direction of instruments. When the price continues to move above the moving average line, the tool is on an uptrend. On the other hand, when the price is crawling below the moving average line, the instrument is on a downtrend. You can also see when a trend is moving forward or reversing. When the price breaks through the moving average line, it usually implies a trend reversal.

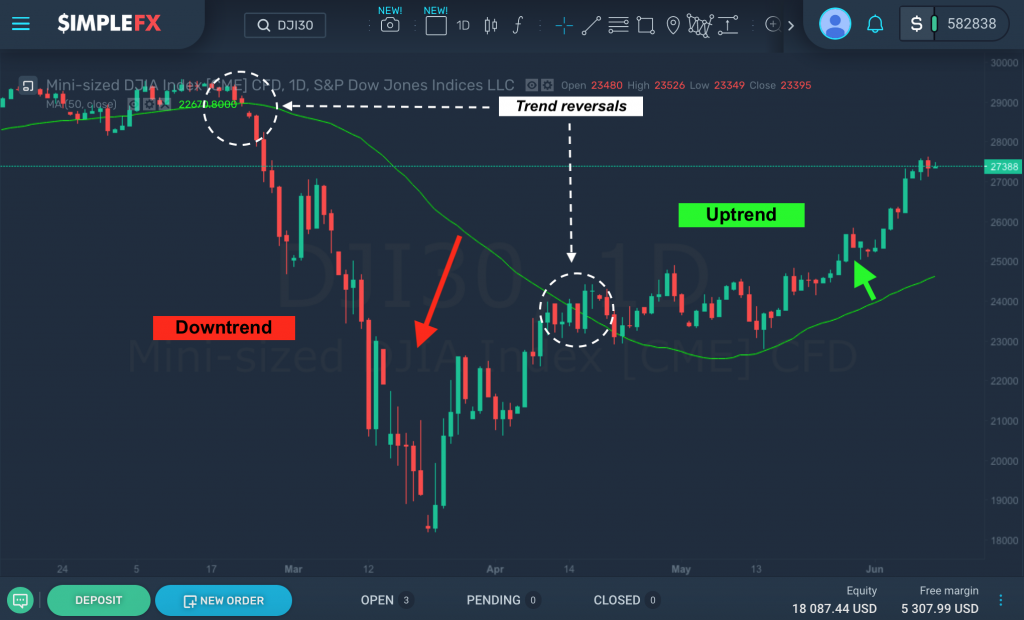
The moving average is a lagging indicator because it is dependent on past prices. Lag is the time it takes for the moving average to signal a possible reversal. So, the longer the period used, the higher the delay. This means that a 20-day moving average is exceptionally fast-moving and gives more reversal signals than a 200-moving average.
Finding Support and Resistance Levels
Traders use moving averages to identify areas of support and resistance and base their trades on these factors. They watch if the price is heading toward or away from the moving average line or whether the price will bounce or break the line.

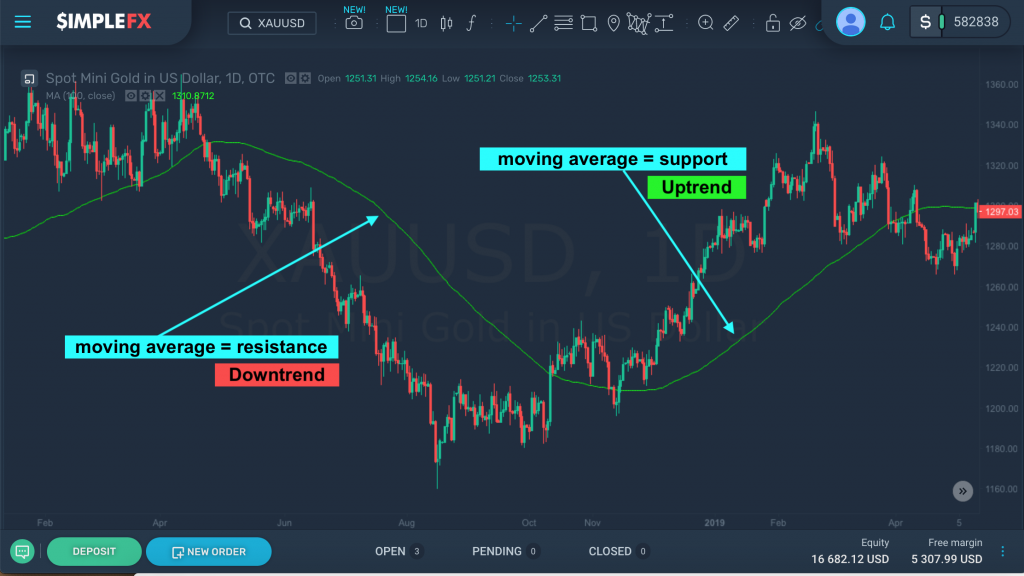
In an uptrend, the moving average line usually acts as the support level. Whereas in a downtrend, the moving average line often serves as the resistance level.
Buy and Sell Timings
Keep in mind that the moving average line is a lagging indicator based on past prices. Therefore, it will only confirm when a trend change occurs, but will not tell you in advance.
So, when do you know if it is the right time to buy? The basic practice is that when the price crosses above the moving average line, it is a signal to buy. Whereas, when the price falls below the moving average line, it is a signal to sell. This is because when the price breaks the trendline, it can foreshadow a new trend direction.
How to Use the Moving Average Tool
SimpleFX employs all necessary tools to help traders get the most of every trade. To access the moving average tool, follow these simple steps.
Log in to your SimpleFX account. Then, choose the symbol. You can choose from the symbols panel on the left or search the symbol from the search box at the upper left part of the screen.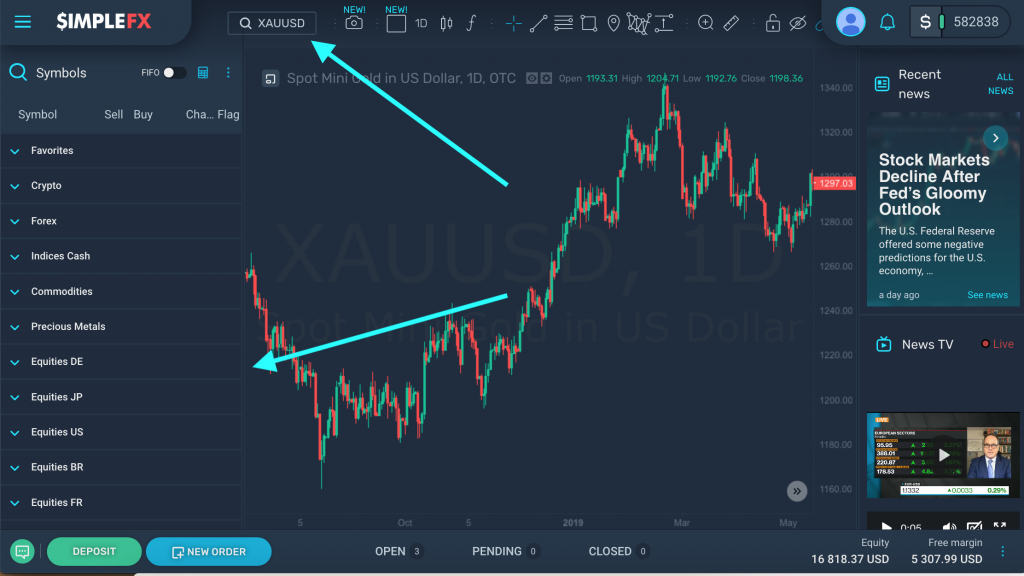

Let’s hide first the side panels to focus our attention on the chart. Just hover over the panel dividers and click on the toggle arrow to hide these panels.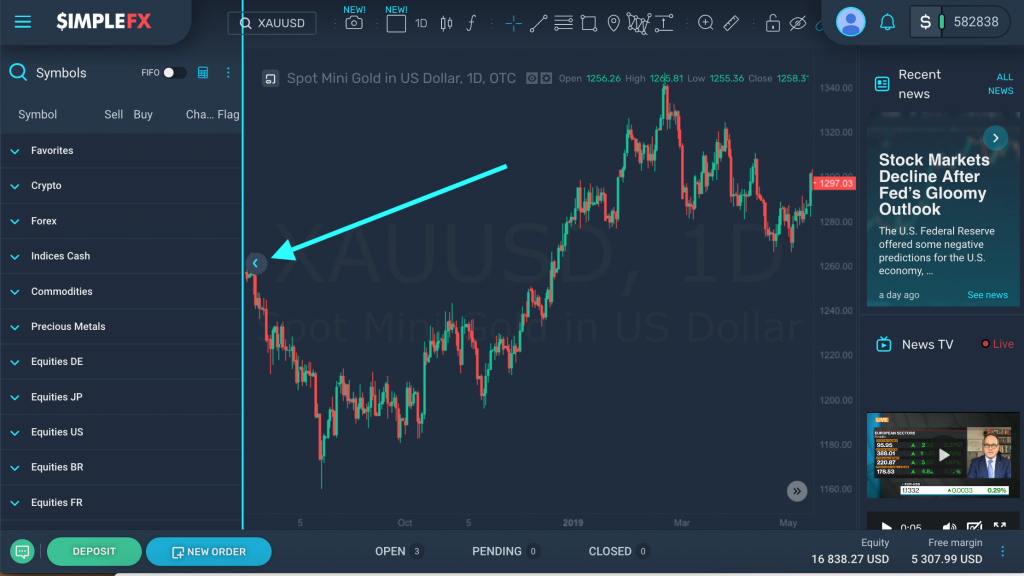
Now, let’s check the chart for spot mini gold in the US dollar. Here is a daily chart of XAUUSD. To use the moving average line on this chart, click on the f icon on the charting tools. Then, choose the “moving average.”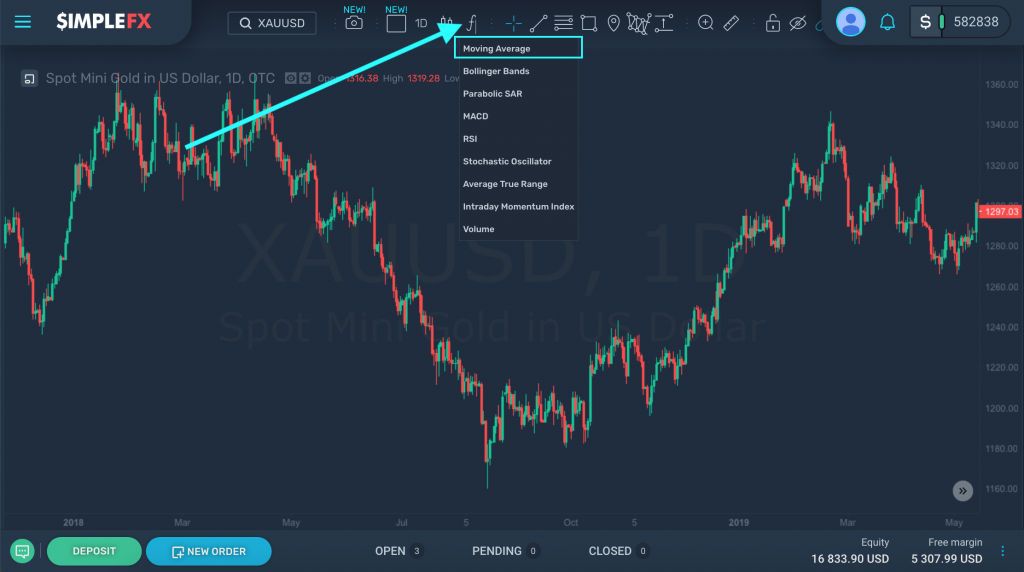

Click on the moving average line to change the time frame and other properties. Let’s set a 50-day moving average for this XAUUSD daily chart.
In the “Inputs” tab, you can change the length, source, and offset value of the moving average line. In this case, we used a 50-day moving average based on the closing prices of XAUUSD in the last 50 days. The offset is set to 0 by default.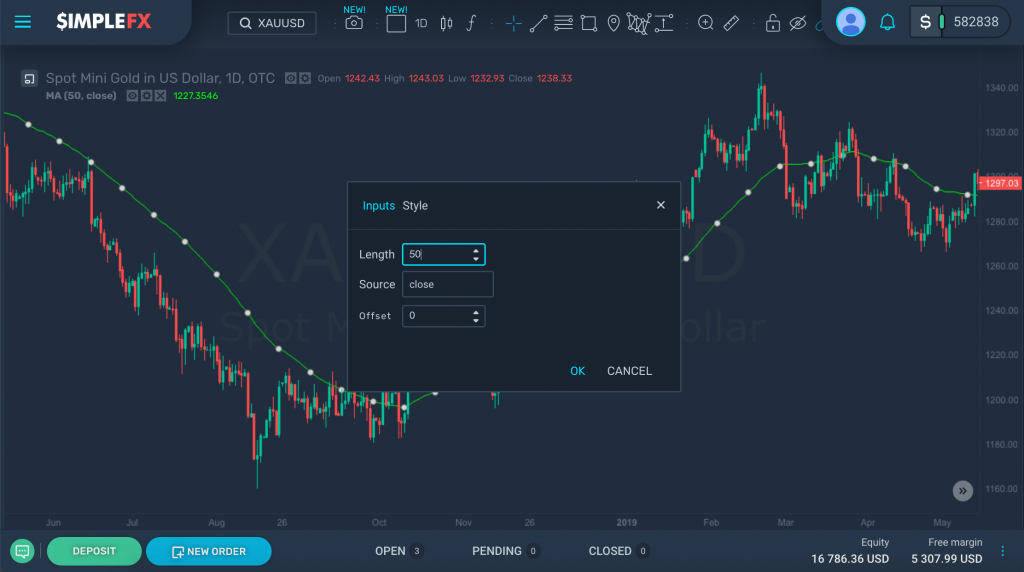
Click on the “Style” tab to change the color, line style, and scale, and to enable the price line.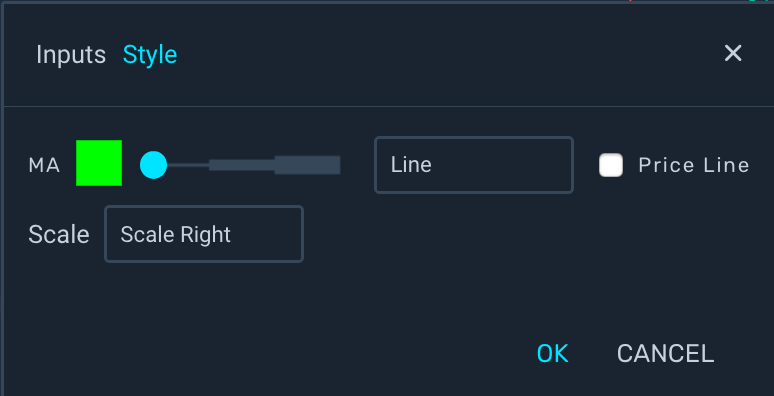

You can access the moving average toolbar on the upper left part of the screen, just below the symbol data. The time frame of the moving average and the prices it is based on are visible. Click on the “eye” icon to show or hide the moving average line on the chart. Click on the “setting” icon to display the line properties. If you want to delete the moving average line, click on the “x” icon.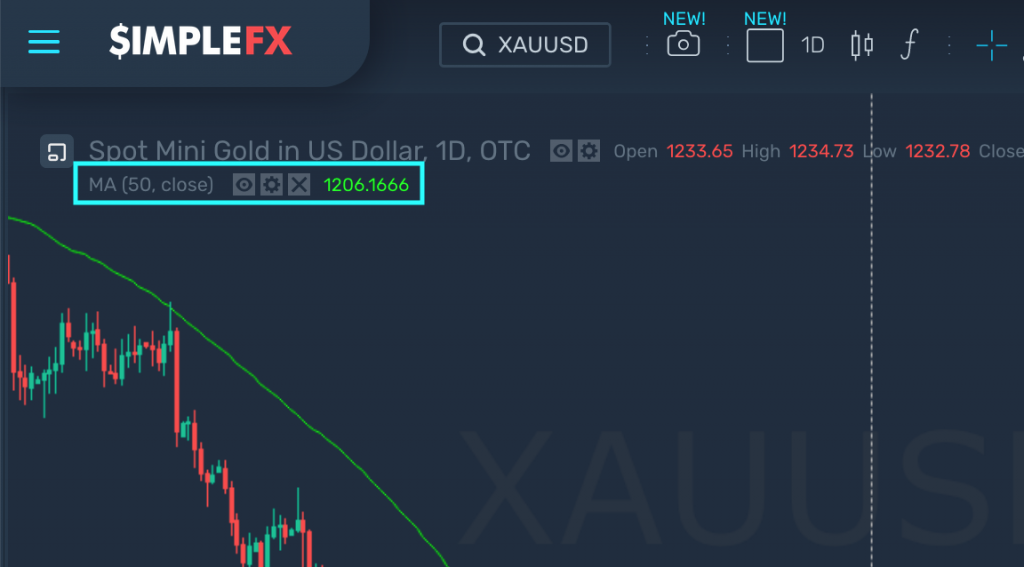

You have now successfully used the moving average line on your chart.
Use it to analyze the market and make more profitable trades. Good luck trading!


