


Reading charts gives you an edge to recognize profitable trades. Whether you are trading stocks, cryptocurrency, or forex pairs, analyzing charts play a crucial part in a successful trading plan. You can spot significant market trends and be confident in your buy and sell timings.
Charts show you how the price of an instrument goes up or down in a specific period. The visual presentation of the market makes it easier for traders to find profit opportunities, especially in news-directed volatile markets.
Looking for Market Trends in a Chart
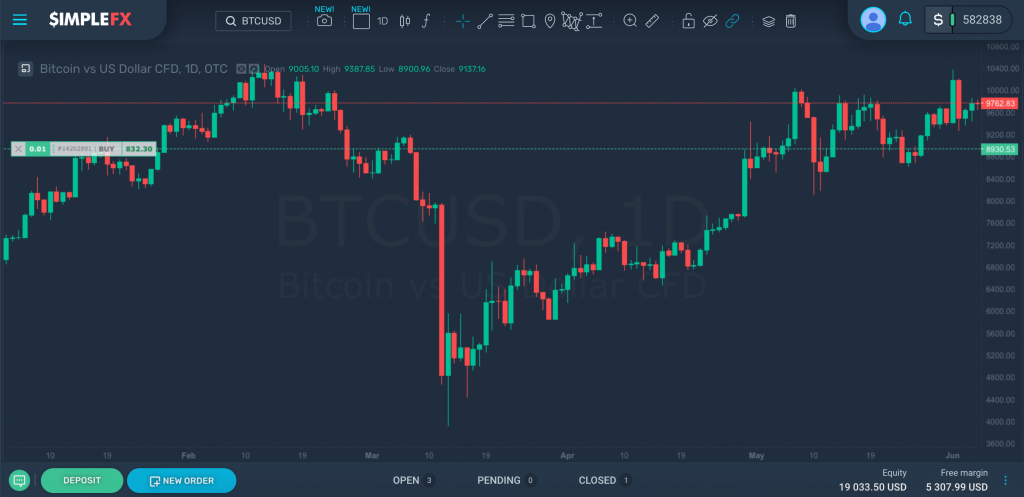
The candlestick chart is the most popular chart that traders use. It is composed of individual candles showing the price movement of an instrument in a set period (by minutes, hours, days, weeks, or months). You can see if the price goes up (green candles) or down (red candles) and how large the price changes are (candle body).

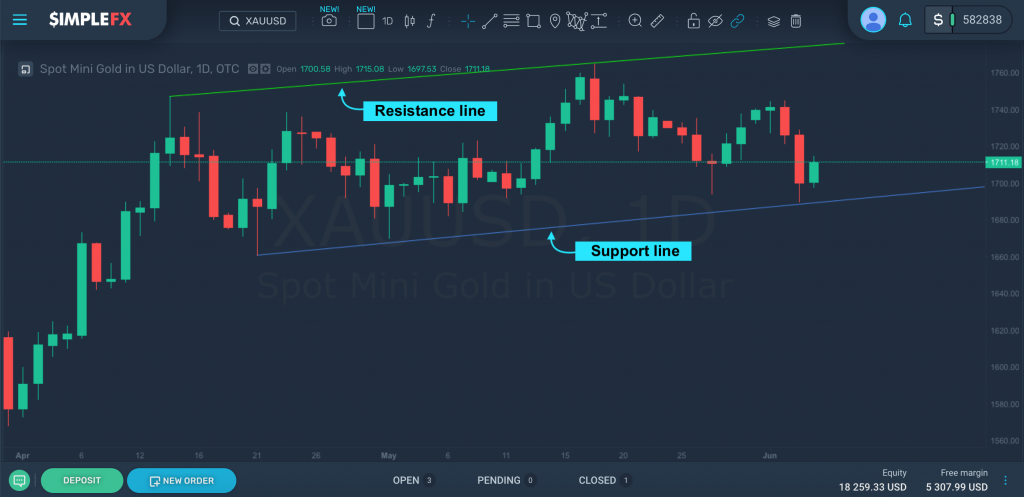
The resistance line and the support line are the two main types of trend lines that traders watch. These lines represent levels where the price of an instrument will not pass through easily. They help traders predict short-term price moves of an instrument and influence the timing of rewarding trades.
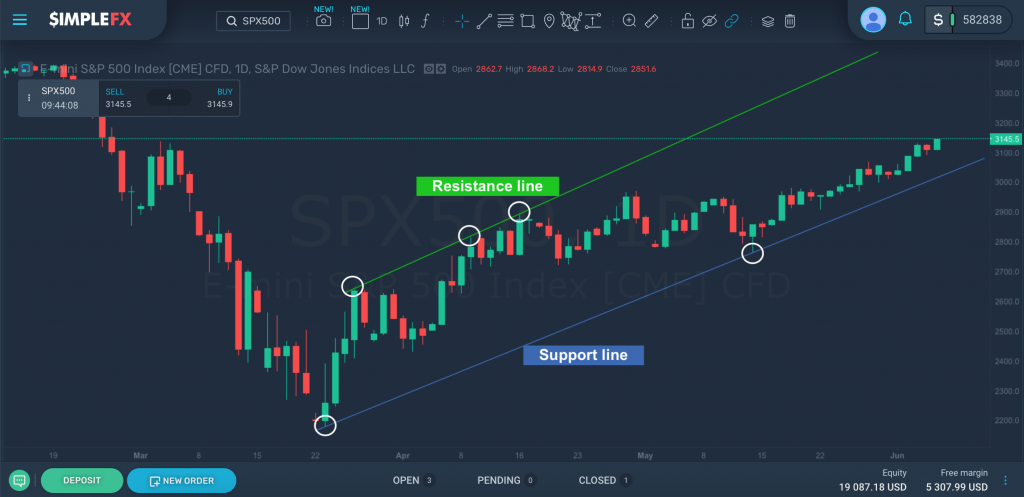
The resistance line shows the level where the price is unlikely to go above. This means that when the price touches the resistance line, it is expected to drop. You can form a resistance line by identifying two or more peaks on the same level and connecting them with a line.
The support line marks the level where the price is unlikely to go below. Traders expect the price to rise after it touches the support line. Find at least two bottoms on the same level and connect them with a line to make a support line.
Drawing the resistance and support lines lets traders see if the market is making an uptrend (price gradually increases) or a downtrend (price gradually decreases). In an uptrend, traders buy near the support level. Whereas, in a downtrend, traders sell near the resistance level.
Keep in mind that trend lines may not necessarily hold for long. When the price is strong enough, it can make a break and go beyond the resistance line or the support line as the market develops.
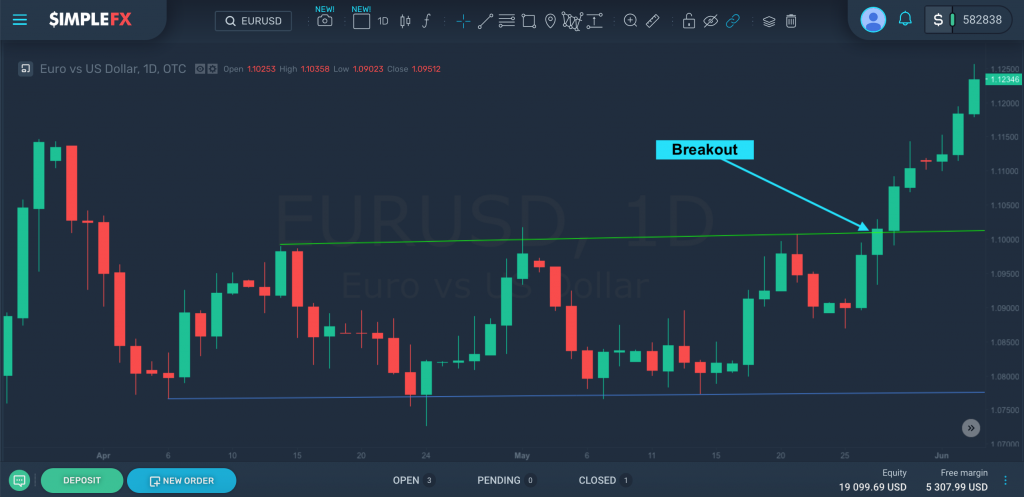

When the price breaks through the resistance level and closes above it, a “breakout” occurs. A breakout signals a buy action because the price is likely to continue upward. On the other hand, when the price drops below the support level and closes below it, this is known as “breakdown.” A breakdown signals a sell action because the price is likely to continue downward.
When the price breaks through the resistance or support levels, then it is time to form another set of trend lines to watch. In a breakout, the resistance line becomes the support line. In a breakdown, the support line becomes the resistance line.
How to Draw the Resistance Line and the Support Line
SimpleFX has basic and advanced charting tools to help you with your analysis. To draw the resistance and support lines on the trading platform, simply follow these steps.
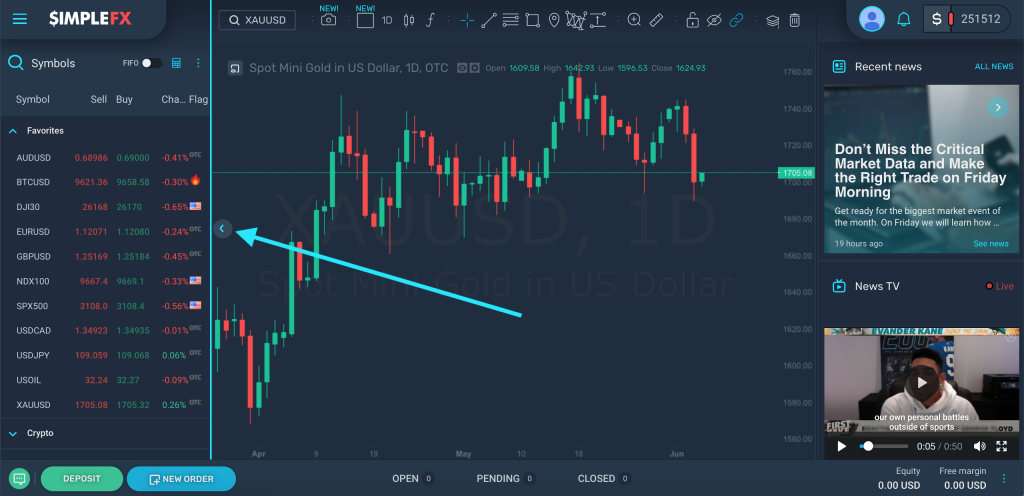
Log in to your SimpleFX account. Choose an instrument, and choose the time frame for your chart. In this case, let’s use a 1-day chart for XAUUSD (spot mini gold in US dollar).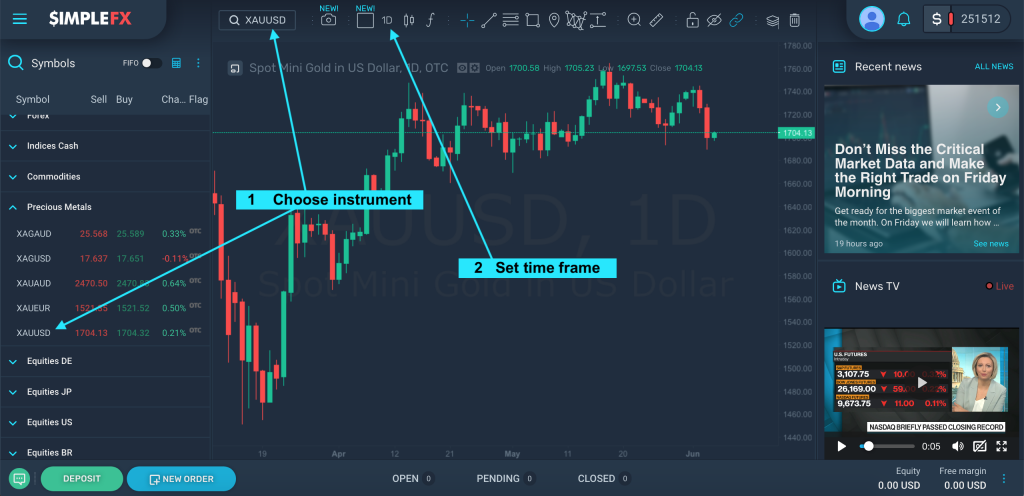

You can toggle the side panels to hide them and focus on the charts. Just hover on the panel divider, and click on the toggle arrow to hide that panel.
It’s now time to identify the patterns. Scroll up or down to zoom in or out the chart. Remember that you need two or more peaks for the resistance line and at least two bottoms for the support line.
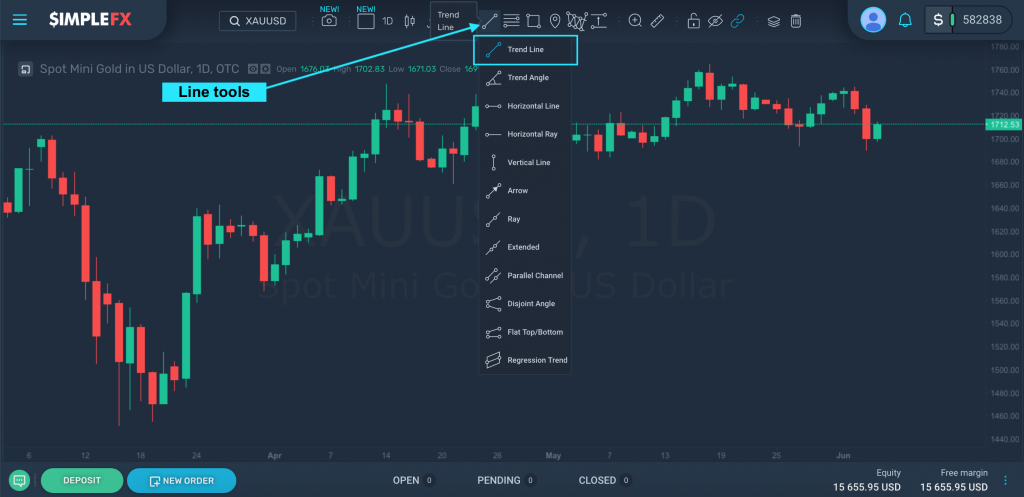
To make a trend line, click on the Line tools and choose “Trend Line” from the drop-down list.
Form the resistance line by clicking on the first peak and then the second peak. To form the support line, click on the “Trend line” tool again, and then click on the first bottom followed by the second bottom.
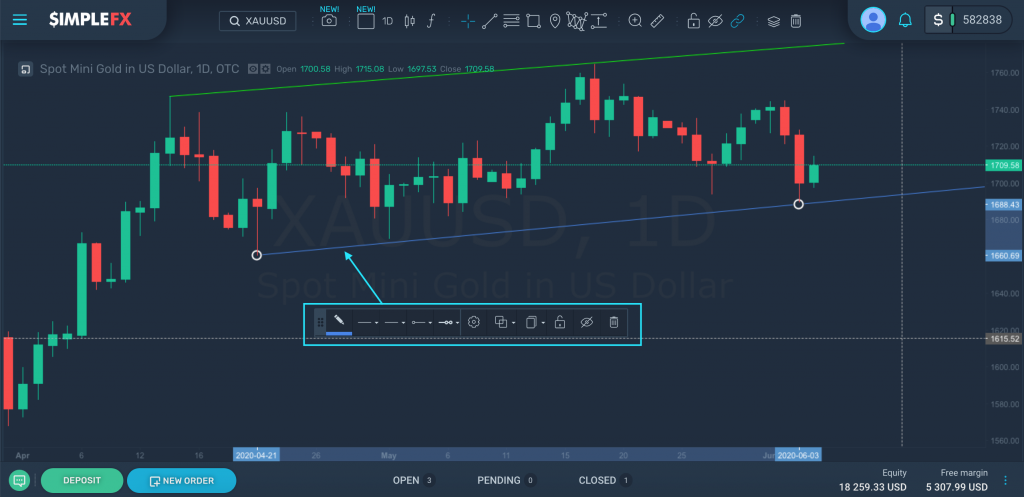
You have now successfully drawn the resistance line and the support line for this chart.
To change the color, width, style, ends, and the visual order of the lines, just click on the line to reveal the line properties tool. To delete the line, just click on the trash icon at the right-most part.
You now know how to create trend lines on the SimpleFX platform. Use it to make more successful trades. Good luck!


