


We’ve picked three most significant assets tradable on SimpleFX. SPX500 for those interested in US stocks. The sellout continuous, but the deeper the shares deep into the ground the closer we may be getting to the bottom. Additionally, there’s always a chance for using the Fibonacci retracement tools to make a profit.
Margin trading USOIL is probably the most exciting thing you can do in financial markets. The commodity is going to react strongly to both economic and political news.
Finally, gold. The central banks and governments all over the world are releasing unprecedented stimulus packages. How much longer will the financial system be able to go on like this? In case of any kind of major failure, XAUUSD should take off to the sky.
SPX500 – Bears are Taking Over for Good?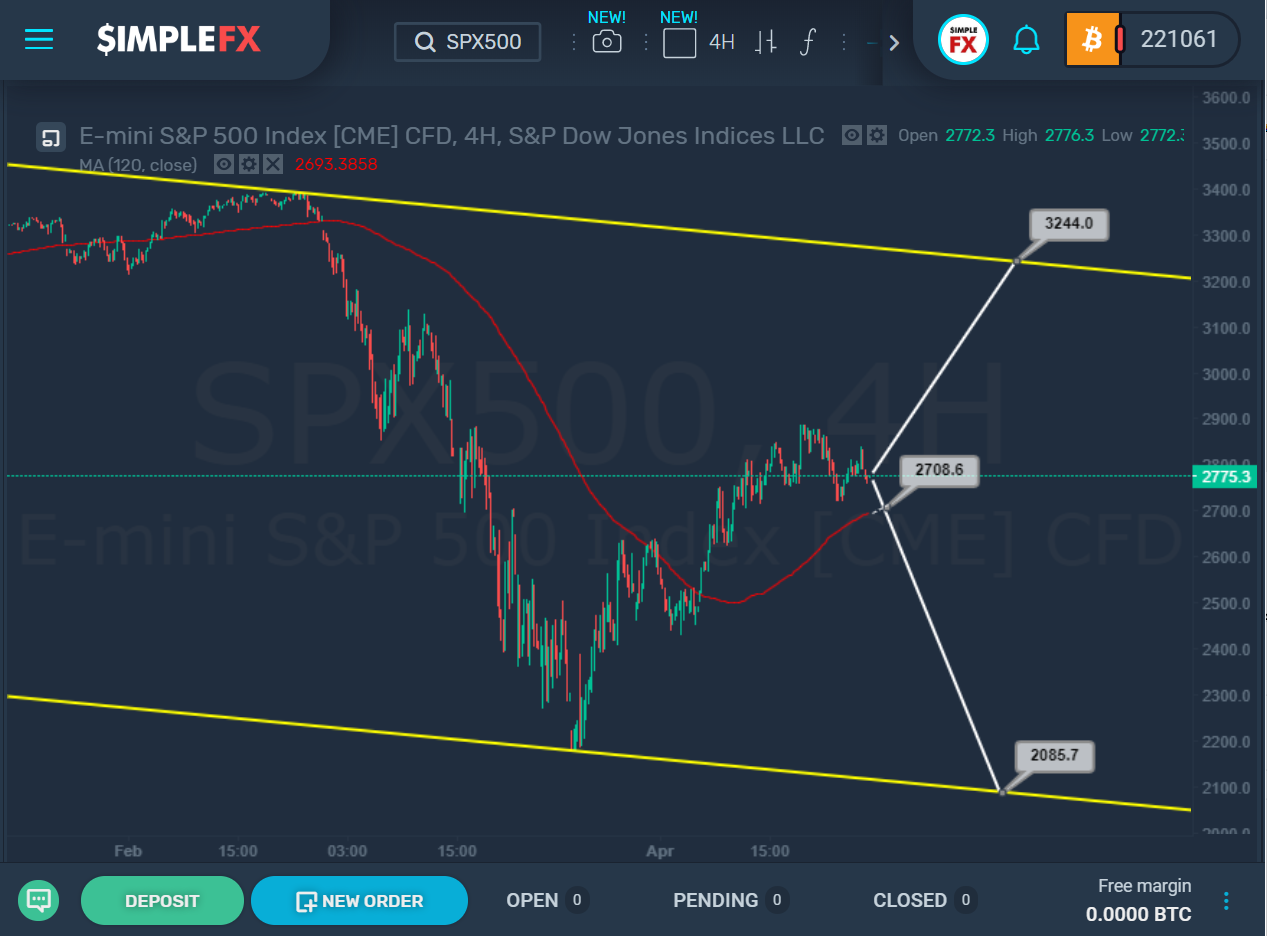

The current SPX500 structure indicates that the market has recently formed a dominant bearish trend, which formed the lines of the yellow channel. After that, the price started moving in a bullish direction, possibly in the area of the upper wall of the yellow channel.
At the moment, the upward scenario is relevant, since the market is above the red line of the moving average. If the market continues to move in this manner and does not go below the support level of 2708.6, which forms this line, then the bulls will continue to move up to the upper line of the yellow channel and the resistance level of 3244.0.
However, if we see a break below the support of 2708.6, then the way will be opened for bears to the next significant support level of 2085.7, which is on the lower wall of the yellow channel. Moreover, it should be taken into account that the bearish trend, in this case, could be rapid, since the movement will occur in the direction of the yellow channel lines’ tilt.
Thus, we will continue to observe how the market will behave soon in the support area of 2708.6.
USOIL recently? Probably the most exciting commodity ever

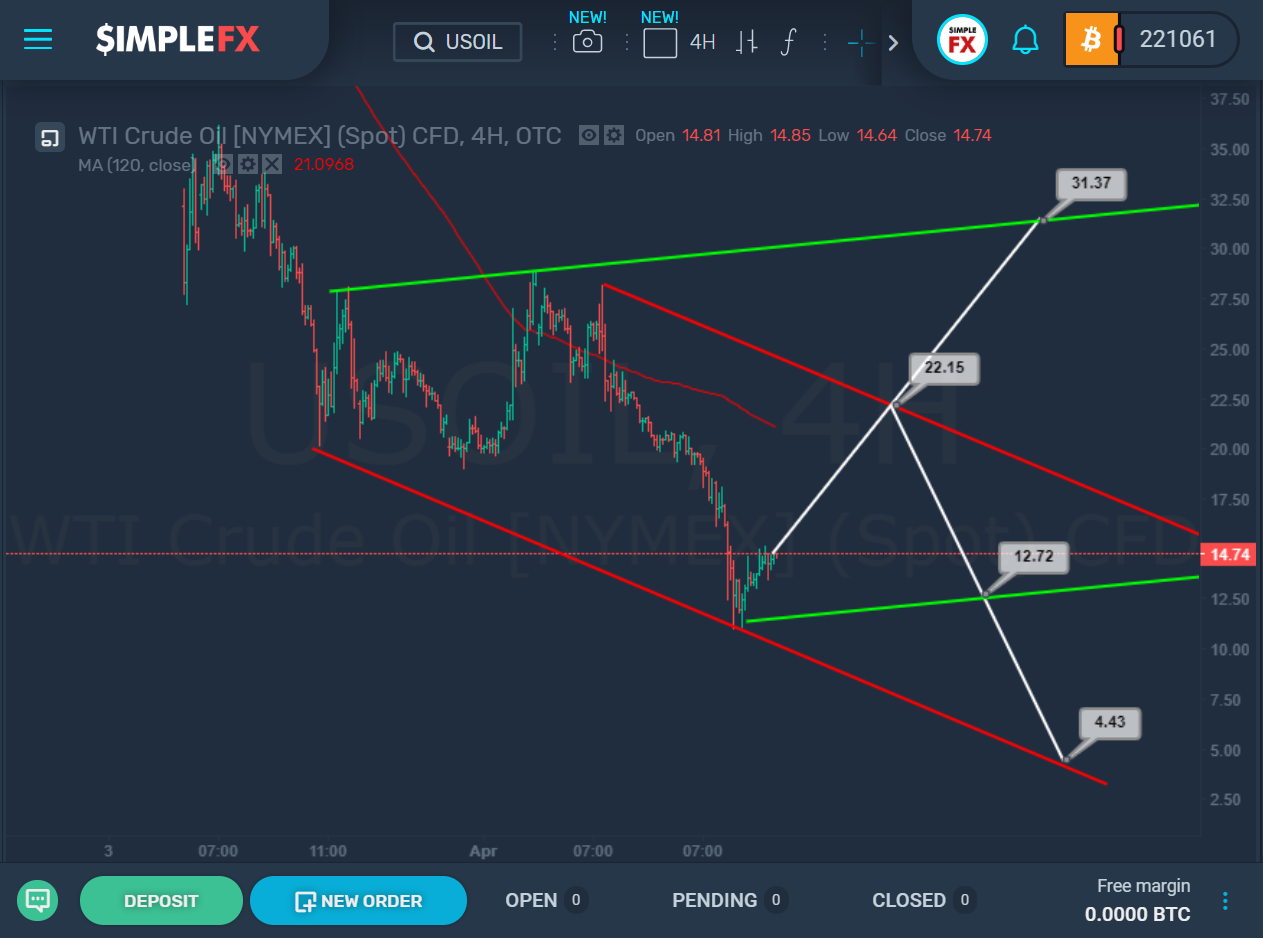
The USOIL situation indicates that a massive bearish trend is forming in the market, with the green and red channels built on the last part of it.
The previous rapid bearish movement was likely completed, so now the market could smoothly rise in the direction of the upper line of the red channel. If this hypothesis is correct, we could see the market grow in the course of the resistance level of 22.15 in the next trading days.
If this price level breaks, the bulls will open the way to the next critical resistance level of 31.37, which is on the upper wall of the green channel.
We should also consider the second scenario of price movement if the market rises to 22.15. Then we see a rebound from this level, and the bears will open a path in the direction of the lower wall of the green channel and the support level of 12.72.
Then, in the event of a break below this price level, the decline could continue to the 4.43 area, but this scenario should be evaluated as an alternative.
Another point to note is that a possible future local bullish trend in the direction of the 22.15 level will occur against the slope of a reasonably steep red channel. Therefore, this trend could take a corrective form, i.e., the price will move up with a large number of stops and small side sections.
Will Gold Finally Take Over?

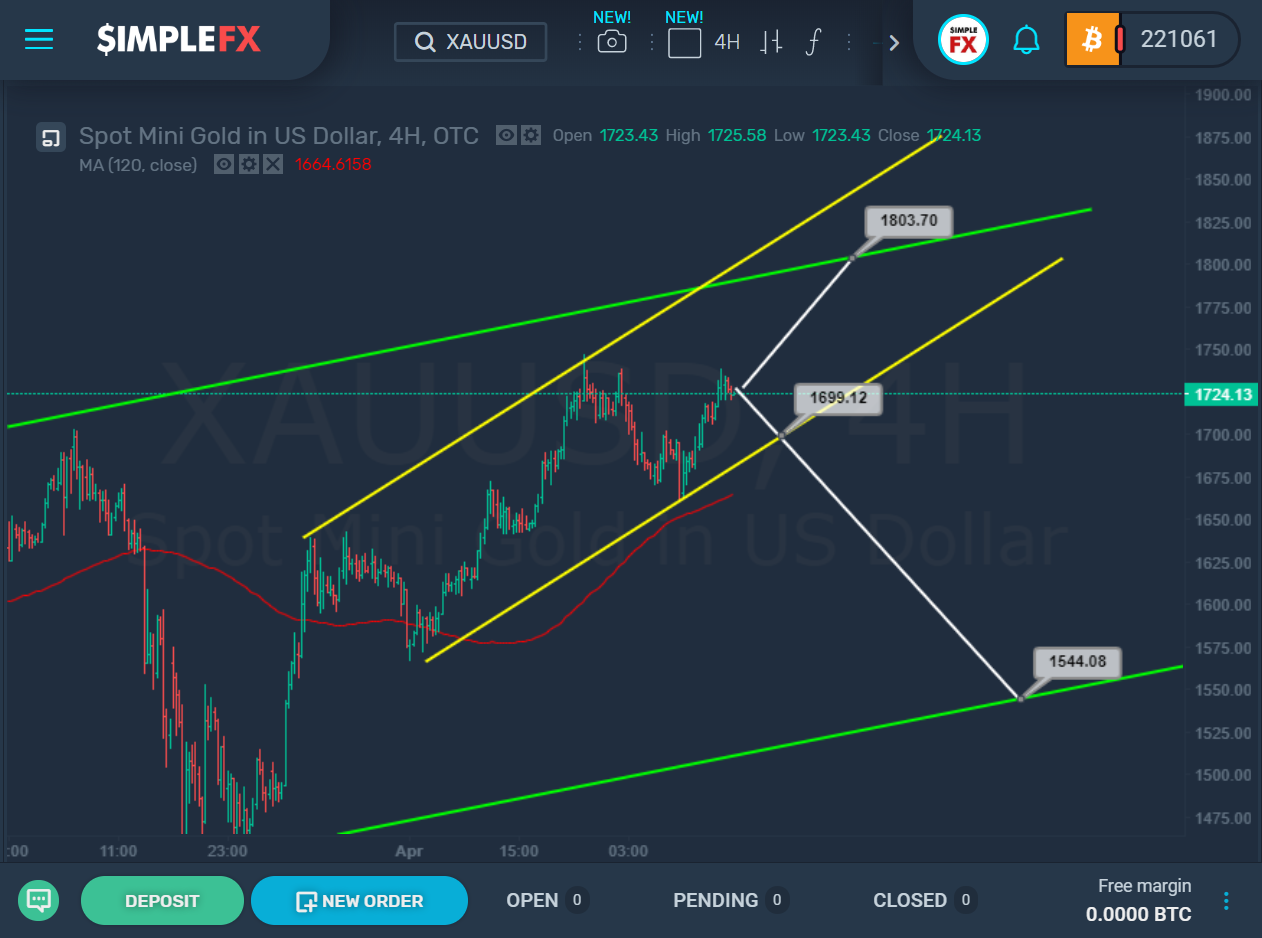
The current XAUUSD structure shows us that the market is moving in a bullish trend inside the green channel. Most likely, the target for bulls is the upper wall of this channel and the resistance level of 1803.70. Therefore, shortly, the price may continue to rise in the direction of the specified target.
Also, it should be taken into account that the bullish trend is described and clarified by the lines of the yellow channel, the lower wall of which is the support line for the price.
If the bears manage to reverse the course of the bullish trend and the price falls to the support level of 1699.12, then they will have a chance to break through this price level.
Thus, if we see that the market has moved below 1699.12, a path will be opened for it towards the next important price support level of 1544.08, which is on the lower wall of the green channel.
Moreover, if the market goes to the lower green line, the decline may continue for a long time, since the bearish trend will be formed against the slope of the green channel, whose lines are directed up.
An approximate scheme of the possible future movement for both possible scenarios is shown on the chart.


