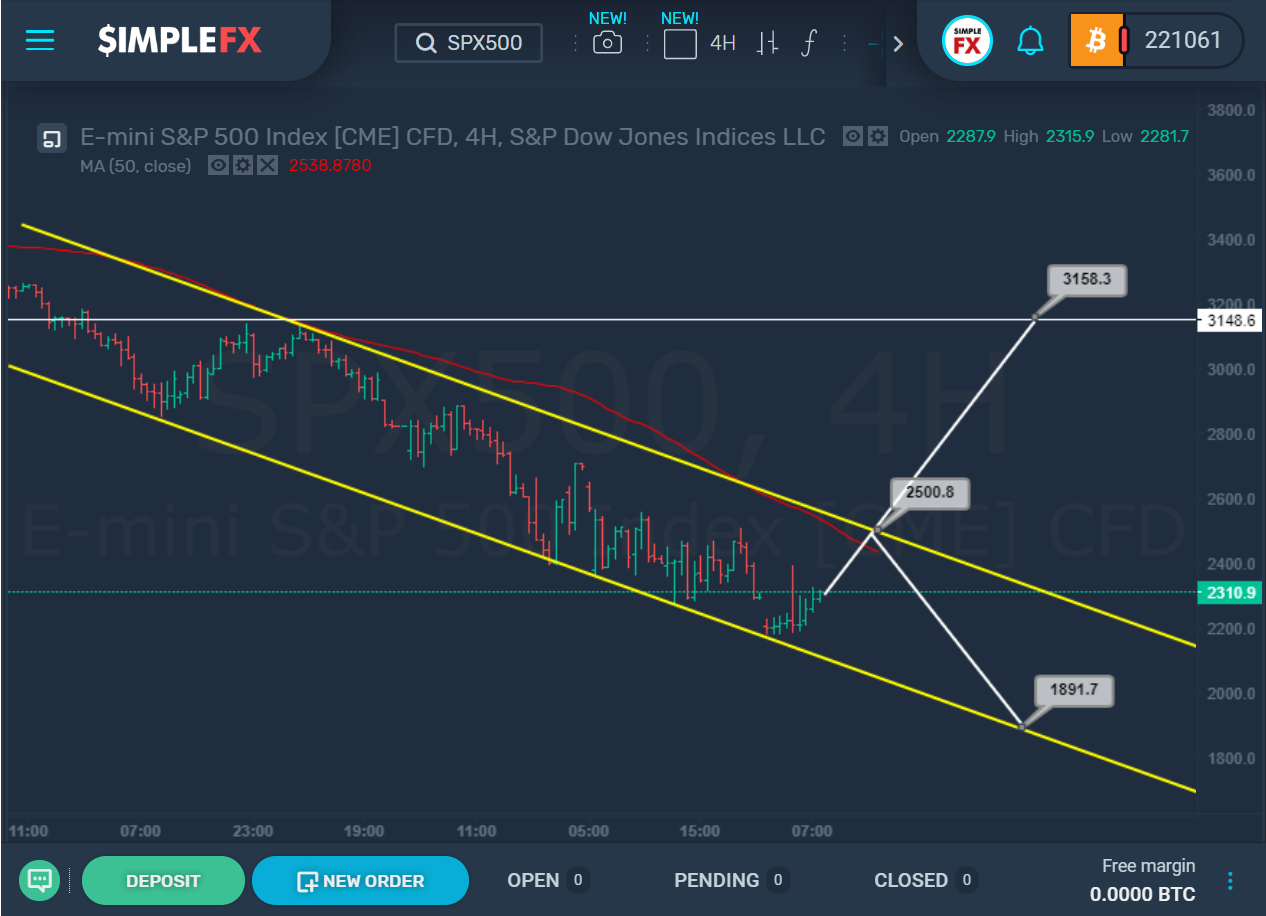
The current SPX500 structure indicates that the market is now moving in a fast and rapid bearish trend, the formation of which began after the end of a significant 10-year bullish trend.
The current decline looks quite natural since no market can grow indefinitely without stopping. Some corrective periods should occur, and we are currently seeing this period on the SPX500.
The market is moving inside the yellow channel; its upper and lower lines describe the price behavior well.
As for possible future market movements, after breaking the upper yellow line and the level of 2500, the way to the level of 3148.6, which is at the last most prominent maximum, may be open for the bulls.
However, if the price rises to 2500 and pushes back from this level, then we could expect a decline to the lower line of the yellow channel and the support level of 1891.7.
However, it should be noted that even if the upper yellow line is broken and the price rises to the level of 3148.6, after the completion of this small bullish trend, the market will continue to move down and update the latest lows, as a correction to the previous 10-year bullish movement is currently being formed.
It is preferable to add this pair on our watchlist!
What’s the Long Term Trend on Gold?
The structure on XAUUSD hints to the fact that after the completion of a relatively sizeable bullish trend, the market began to form a bearish correction or a new downtrend.
At the moment, the descending yellow channel describes the price behavior very well. The price fell to its lower wall, then pushed back from it, and at the moment, the bulls are approaching the upper yellow line and the resistance of 1587.74.
If this price level is broken above, the way to the upper line of the green channel and the resistance of 1724.69 will be opened for the bulls.
However, if we see a rebound from the level of 1587.74, then we could expect a decline to the green line and the level of 1464.62.
If this price level is broken below, the bears will get enough strength to lower the price to the lower yellow line area to the level of 1303.81.
Thus, if the bearish scenario is relevant, the market will continue to move in the yellow channel. If the bullish scenario is applicable, the market will run on the green channel. Both of these channels are represented on the XAUUSD chart.
Everybody Wants Cash, Which One is Better?
Analysis of the EURUSD currency pair indicates that the market moved in a bearish green channel during the previous trading weeks.
Recently, the price started forming a bullish correction. It is not clear yet whether this is a small correction that will not break the lines of the yellow channel, or whether we will see the price rise above the upper yellow line and the resistance level of 1.078.
If the resistance of 1.078 breaks, the bulls will open a path towards the upper line of the green channel and the resistance of 1.132.
An alternative scenario can be implemented if a break occurs below the lower wall of the green channel and the level of 1.061. In this case, the bears will open a path to the lower line of the yellow channel and the support level of 1.029.
However, even if the market starts moving soon to the 1.029 area, after reaching this level, we will most likely see a relatively sizeable bullish trend or a considerable corrective wave developing in an upward direction. In this case, the descending green channel will be rebuilt, since the current channel will lose its relevance.