
Tech Stocks (Microsoft and Virgin Galactic), and gold are the three instruments SimpleFX recommends to add to your watch list this week. Take a look at the technical analysis, and plan accordingly.
Microsoft stock show great trading opportunities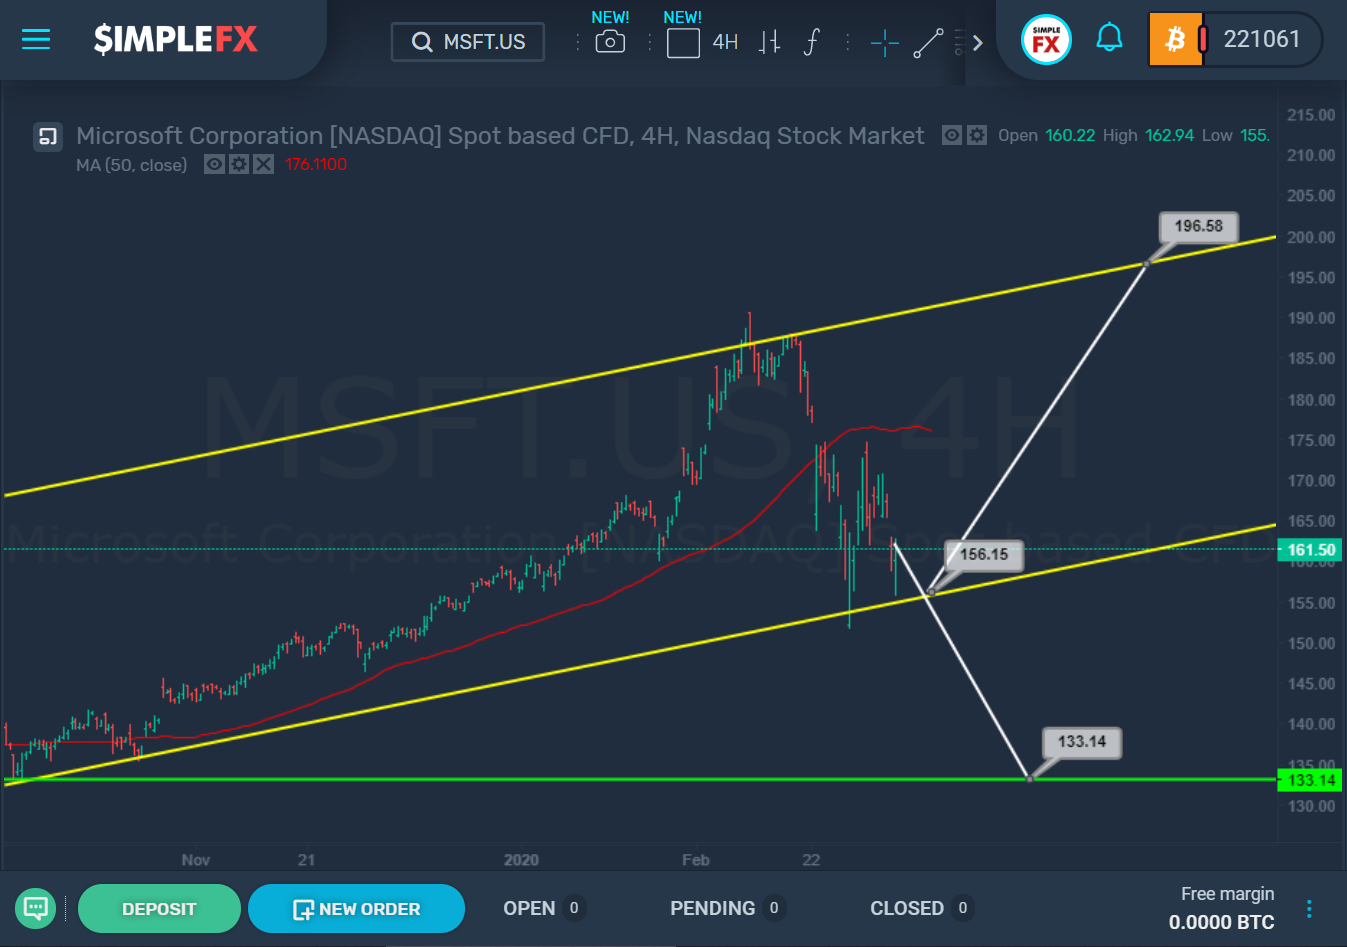
The market continues to move within a large and long bullish yellow channel. After a gradual ascent to the upper wall of this channel, we saw that the bulls temporarily went above this line, and then returned to the territory of the yellow channel.
Then the market began to fall rapidly and broke the red line of the moving average. Subsequently, the lower line of the yellow channel was reached, after which there was a rebound from it.
It is not clear how the market will behave in the future. However, we could expect that in the near future the price will fall to the support level of 156.15, which is on the lower line of the yellow channel. Then, in the event of a rebound from this support, an increase in the direction of the upper yellow wall and the resistance level of 196.58 is possible.
However, if the bears manage to break below the support of 156.15, the market could expect a decline to the green horizontal line and the nearest important support level of 133.14, which is on this line.
Virgin galactic stocks could be very volatile
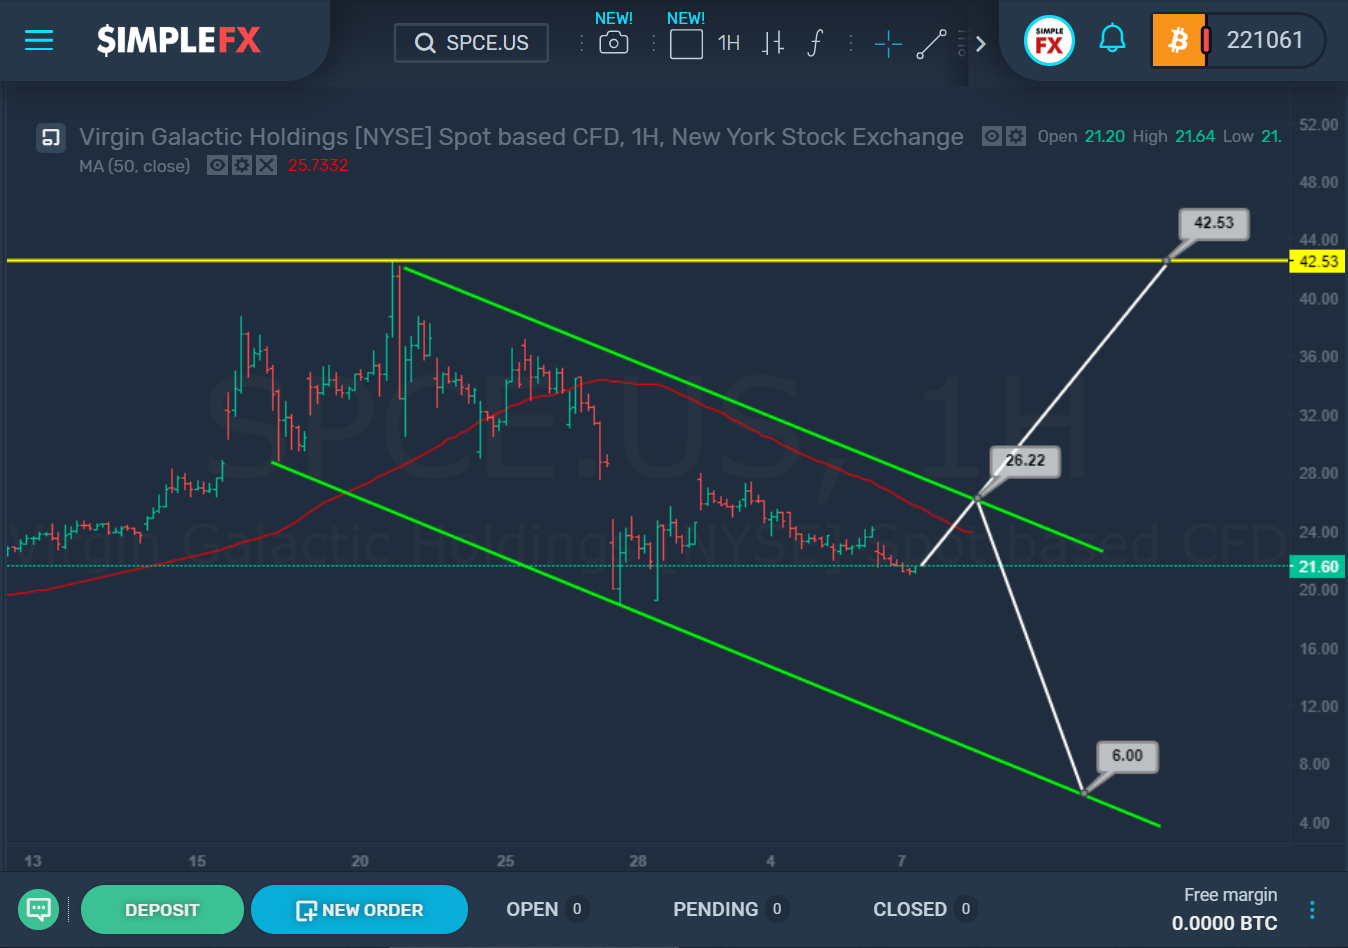
The current SPCE.US structure indicates that the market is forming a bearish trend that moves within the green channel. The price dropped quite rapidly to the lower line of this channel, after which we saw a sideways movement of the market.
It is likely that in the coming trading days, the market will smoothly approach the upper line of the green channel and the resistance level of 26.22. in this case, the resistance that forms the red line of the moving average will be broken, but the level of this resistance was not specified, since it is close to 26.22.
Further, after the market approaches the level of 26.22, we can see a rebound and decline in the direction of the lower line of the green channel. In this case, we will expect a bearish trend to the level of 6.00.
An alternative scenario can be implemented in the event of a break above the resistance of 26.22. in this case , the way will open for the bulls in the direction of the next important resistance of 42.53, which is on the yellow horizontal line.
The yellow horizontal line was drawn through the level of the last maximum located at the beginning of the green channel.
In cases where current market conditions do not allow to build a channel, horizontal lines are drawn through important highs and lows.
Gold is the key asset during the market turmoil
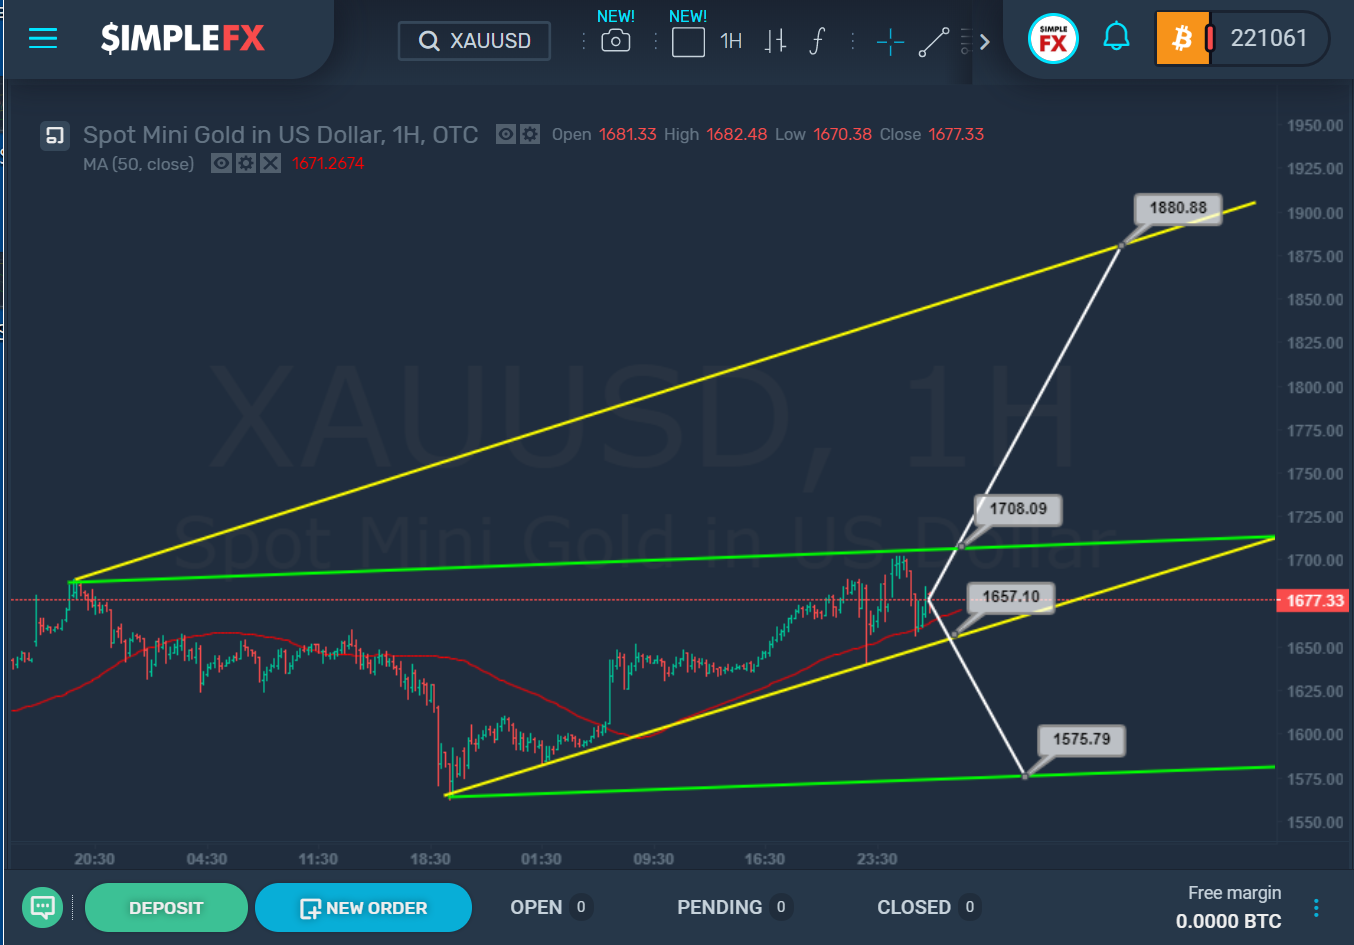
The current XAUUSD structure indicates that the market is forming a bullish trend that is moving in the direction of the upper line of the green channel. Moreover, the price is gradually creeping along the lower line of the yellow channel.
Two different scenarios are possible in the near future. Either we will see a break above the resistance of 1708.09, which is on the upper wall of the green channel, in this case, the market could expect an increase to the next important resistance of 1880.88, located on the upper yellow line.
Or we will see a slight decline and a break below the support level of 1657.10, which is on the lower yellow line.
In this case, a path will be opened for bears in the direction of the level of 1575.79, which is on the green line.
Thus, in the current situation, it is recommended to stay out of the market and wait for which of the levels will be broken faster 1708.09 or 1657.10, then, after the break of one of these levels, it will be possible to draw appropriate conclusions.