Two forex pairs – EURUSD and USDJPY – offer the most intriguing opportunities this week, according to SimpleFX analysis. The coronavirus epidemic has already created some unseen market moves. The stock exchanges can be very volatile in the upcoming days. That’s why we are taking a closer look at the S&P 500. Take a look at the analysis, include it in your strategy, and make the right order at the right time.
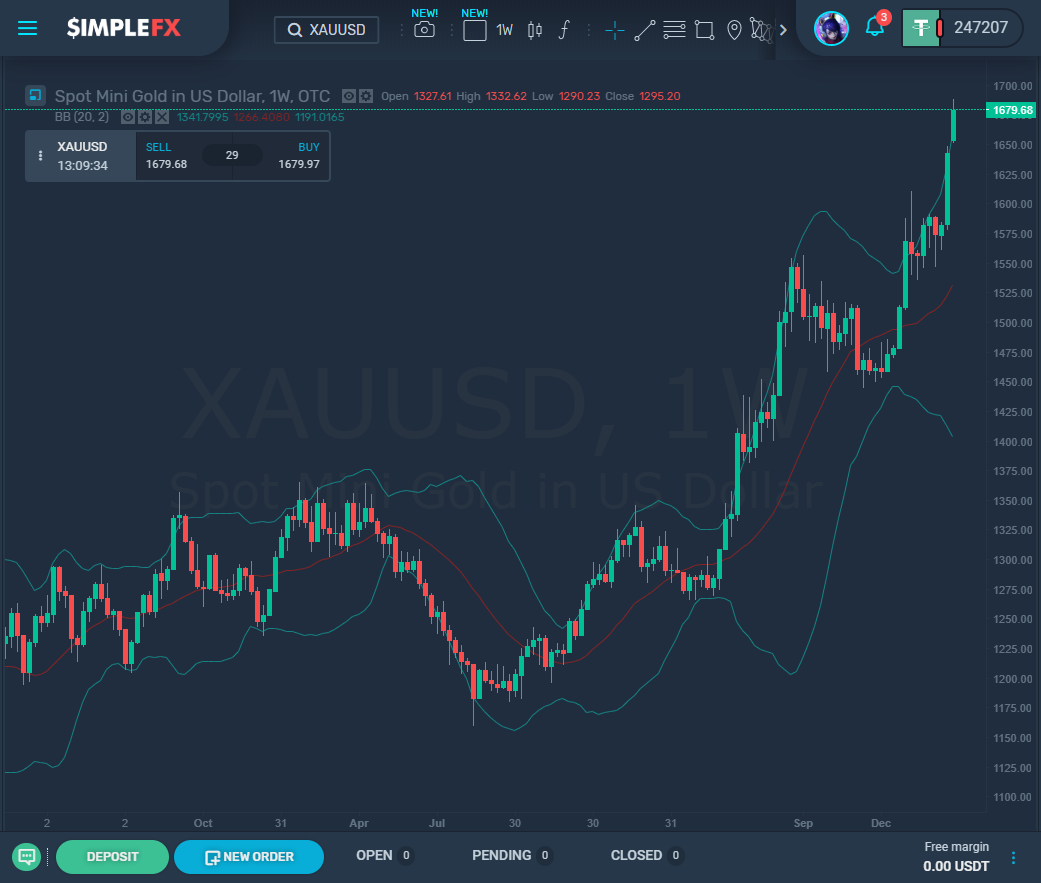
Contracts on US stocks are going down before the trading hours begin. DAX30 dropped almost 4% in the first hours of Monday trading, while Asian indices are also down. USOIL fell almost 4%, and the US treasuries went to a 10-year low. Gold is rallying. XAUUSD has already reached levels unseen since the beginning of 2013.

This is a peculiar event since both the bearish (bonds) and bullish (stocks, oil) markets are in decline. This is an unprecedented situation and is the effect of the coronavirus crisis.
SimpleFX EURUSD Chart Analysis February 24, 2020

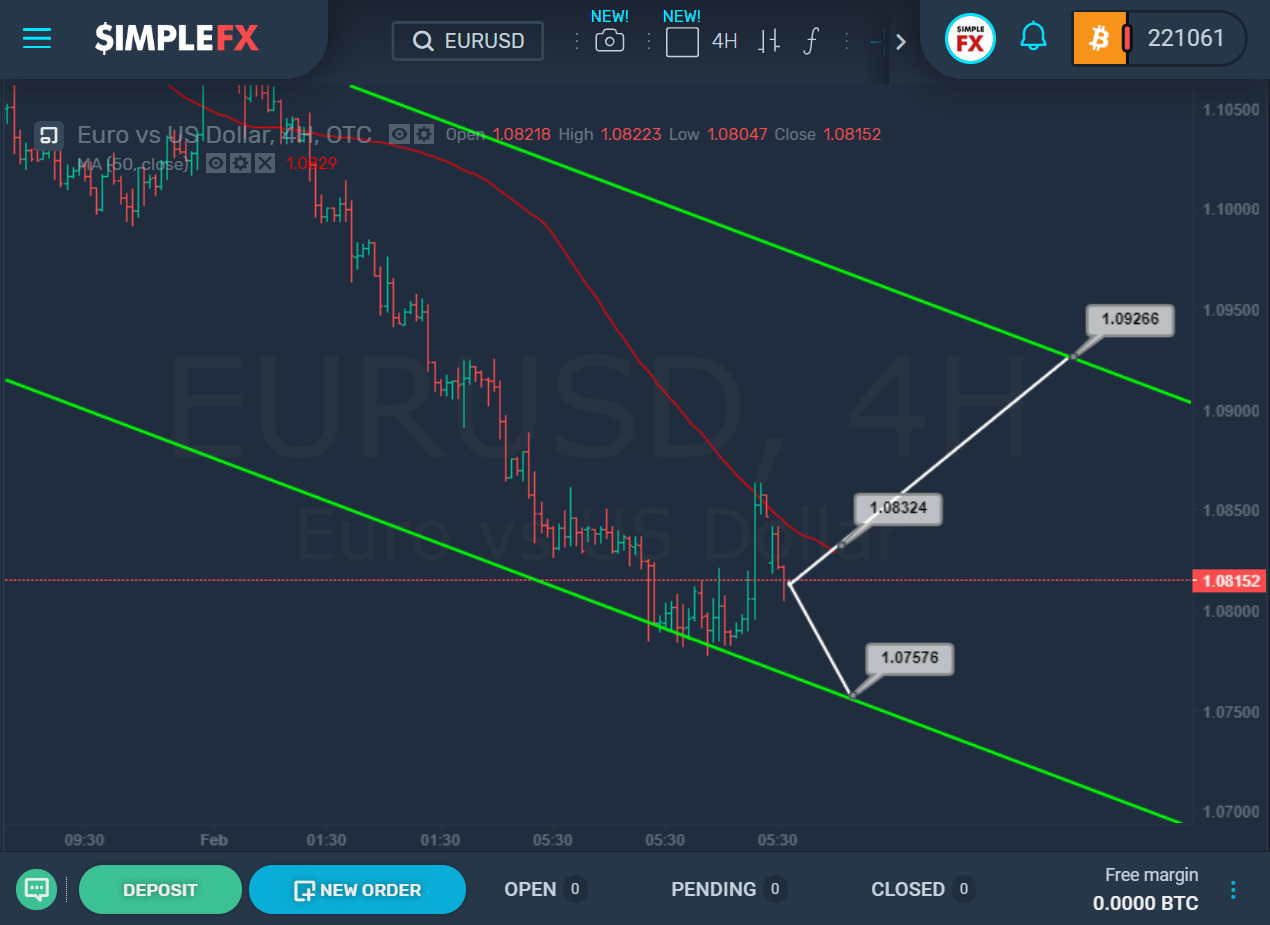
We see a significant downtrend inside the green channel. The price approached its lower bound, and we saw the market marking time. The bears did not go below the lower wall of the green channel, after which the market went in a bullish direction.
The bulls quickly reached the red line of the moving average and pushed away from it. If shortly, the bulls find strength and break above the moving average and the resistance level of 1.083, then they will open a path in the direction of the upper wall of the green channel and the resistance of 1.092. However, it should be taken into account that we are unlikely to see rapid growth in the market since the green channel is directed down, so the bulls will have to move against its slope; this will create an obstacle to the bullish trend.
An alternative option is a repeated decline to the lower bound of the green channel and the support level of 1.075. This option will be implemented if the bulls fail to go above the red line of the moving average.
SimpleFX USDJPY Chart Analysis: February 24, 2020

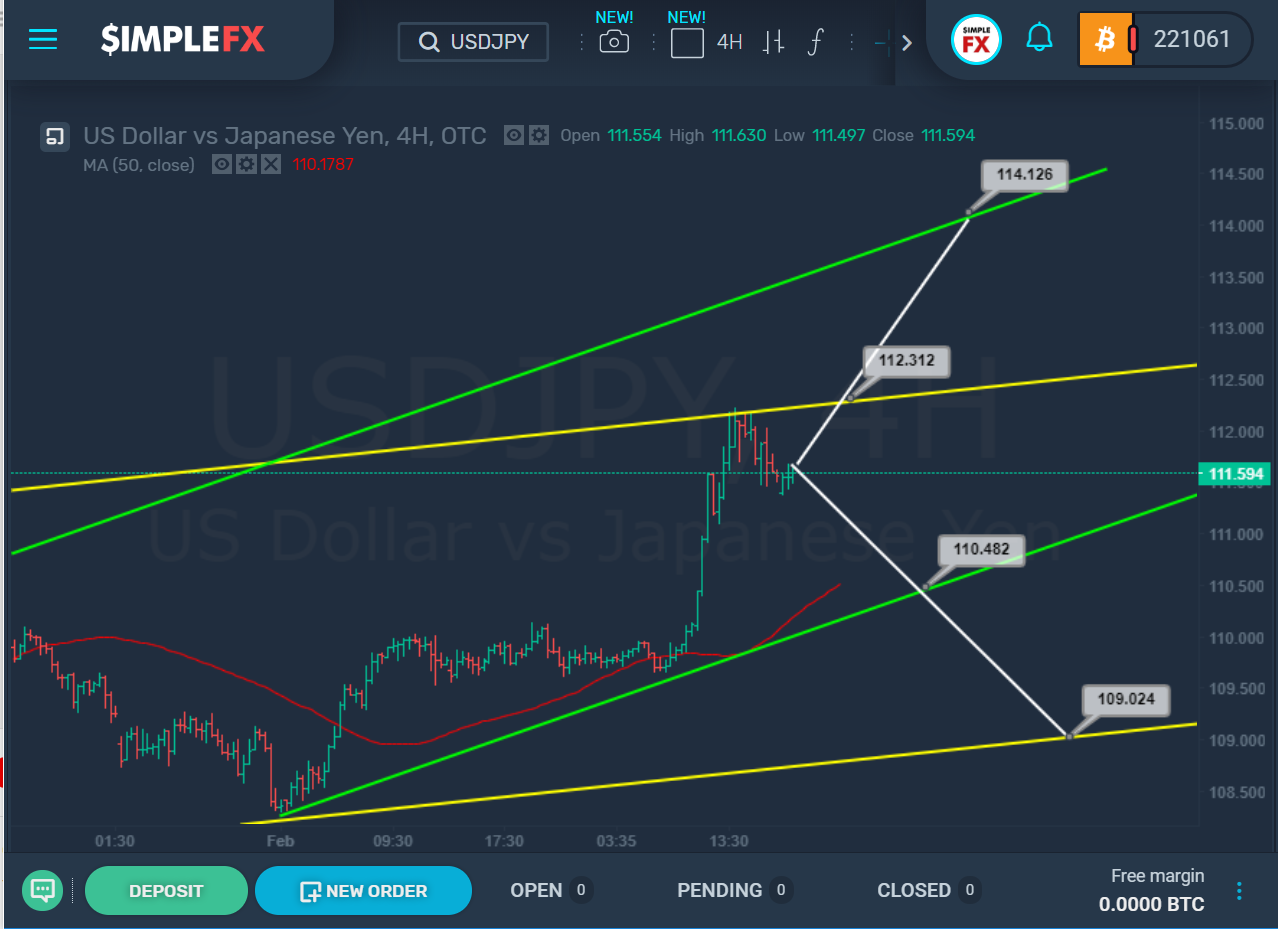
We see quite an unusual situation on USDJPY. During the previous trading weeks, the market quickly rose to the upper wall of the yellow channel after rebounding from the lower yellow bound.
Approximately in the central part of this channel, we saw a sizeable sideways movement, then the bulls abruptly reached the resistance level on the yellow wall. At the moment, it is not clear which of the possible options will move the market.
Either the bulls have enough gas in the tank to break through the resistance of 112.31, which forms the upper bound of the yellow channel. In this case, the growth may continue until the next outstanding support level of 114.12, which is on the upper limit of the green channel.
Either this will not happen, in this case, the bulls will not be able to go above 112.31, and we will see a decline first to the lower wall of the green channel and the support level of 110.48, and then even lower, to the next support level of 109.02, which is on the lower yellow bound.
In any case, very shortly, it is tough to determine which scenario the market will move, so to make more accurate judgments, we should observe whether the upper yellow or lower green bound will be broken in the first place soon.
So let’s keep an eye on this currency pair in the future.
SimpleFX SPX500 Chart Analysis: February 24, 2020

The market has been moving inside the green channel for a long time. During the previous trading months, we saw a smooth increase in the price from the lower bound of this channel, in the direction of its upper wall.
Then, when the upper bound was reached, the bears tried to push the price down, but they failed. The bulls pressed the bears tightly and again and again pressed the market to the upper bound of the green channel.
It should be assumed that at the time of writing, the most relevant scenario is a downward one because the price was near the upper bound for a long time and did not break it. The bears took the initiative and started pushing the price down to the lower wall of the green channel and the support level of 3202.4, so a decline to this level is possible shortly.
According to an alternative scenario, we could expect an increase to the upper green line and the resistance level of 3421.6. Still, this scenario will become relevant only if the red line of the moving average breaks in the area of the resistance level of 3369.3.
Thus, opening short positions according to the main option is a priority scenario at the moment.

