


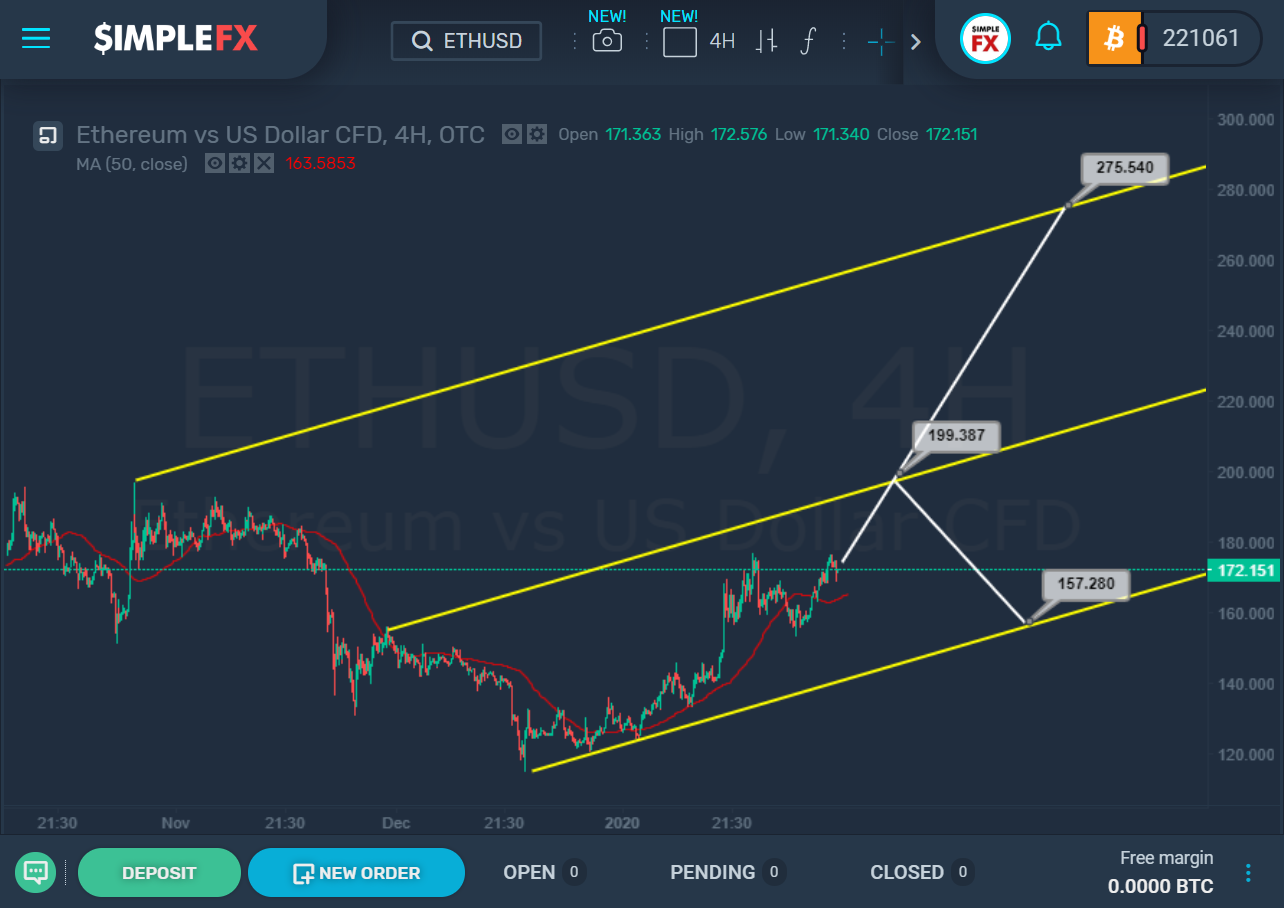

After the market rises to this level, there are two possible scenarios. Or we will see a rebound from this bound and a decline to the support level of 157.28, which is on the lower wall of the yellow channel.
Or, if the resistance level of 199.38 breaks, the bulls will open a path in the direction of the upper bound of the yellow channel and the level of 275.54. In this case, we can see a strong bullish trend.


