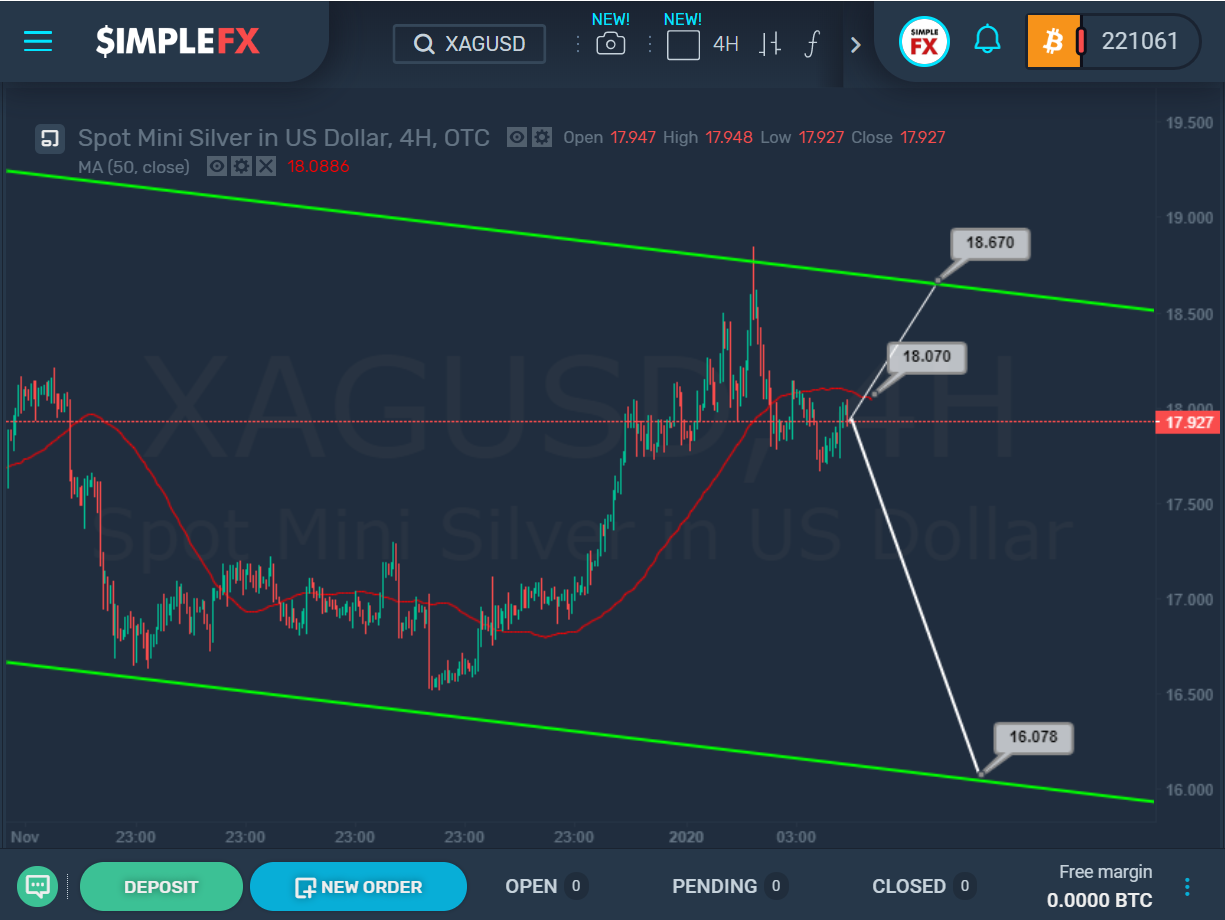
 The current XAGUSD structure suggests that during the previous trading weeks, we saw a rapid growth of the market from the lower bound of the green channel to its upper wall.
Then there was a rebound and the market began to move down, breaking the red line of the moving average.
It is possible that the main target for the price now is the lower bound of the green channel and the support level of 16.078.
However, the bulls can again raise the price to the upper wall of the green channel and the resistance level of 18.670 in the case of a repeated break of the moving average near the level of 18.070.
The approximate scheme of possible future movement is shown on the chart.
