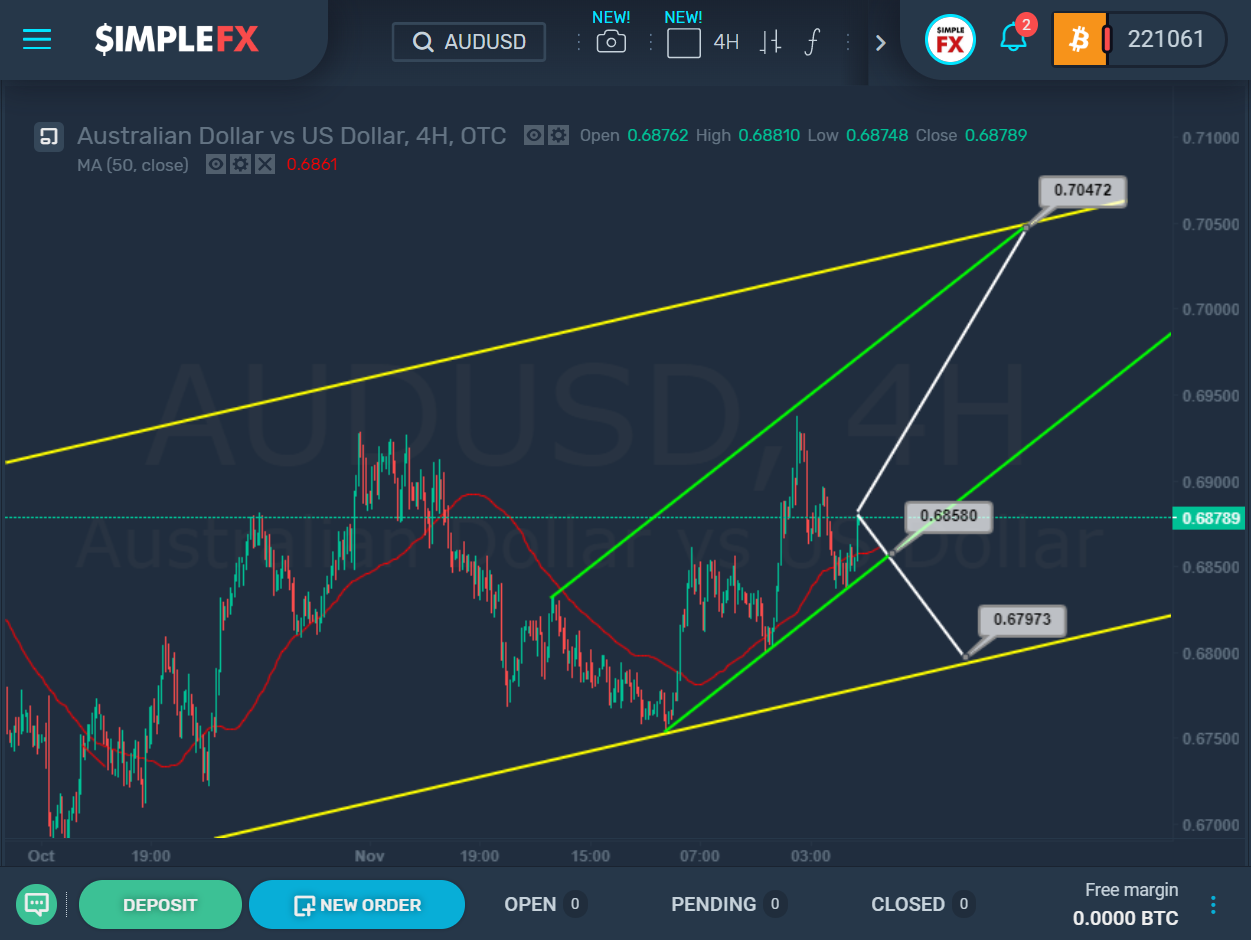
At the moment, it is possible to build two actual channels that describe the behavior of the price. First, after the market rebounds from the lower bound of the yellow channel, we may have seen the initial part of a new uptrend in the direction of the upper yellow wall and the resistance level of 0.704. Thus, during the next trading weeks, the market may grow to this level.

Moreover, the rise will occur inside the green channel. However, if the price goes beyond the bounds of the green channel and the support level of 0.685 is broken, the market may start to move down, in this case, there may be a re-touch of the lower bound of the yellow channel near the support level of 0.679.

Approximate options of how the market may move in the future are shown on the chart.

Share.
Exit mobile version