


Technical indicators may seem confusing to those new to technical trading, but they hold the secrets to success. Here we will break down some of the most popular indicators and how to interpret their signals and how to use popular strategies to turn a profit. This is not meant to be financial advice, but somewhat educational information that might help you on your trading path.
Technical trading is the practice of studying past trends through charts and using the patterns and indicators found to predict the value of stocks in the future. Indicators are created through various mathematical calculations, and they can predict future prices and volume with decent accuracy. All of this is used to show you what the price is likely to become in the future.
The main types of indicators:
- Momentum
- Trend
- Volatility
- Volume
Momentum
Momentum indicators show you how strong the trend is if one exists. They can also be used to predict and potential reversals in current trends. These kinds of indicators are most useful when you are looking to find price tops and bottoms. Examples of this kind of indicator include the Average Directional Index (ADX), Ichimoku Kinko Hyo, Relative Strength Index (RSI), and Stochastic.
Trend
This type of indicator shows you which direction the market is moving. Sometimes there may be no discernible trend at all. Often trends swing between high and low values, and for this reason, they are sometimes referred to as “oscillators.” Common examples of trend indicators include Moving Average Convergence Divergence (MACD), Parabolic SAR, and parts of the Ichimoku Kinko Hyo, all of which will be discussed in further depth later on.
Volatility
This indicator shows you how much a price fluctuates over a given period. This is incredibly important, not just as an indicator but as part of the market. The price needs to change for you to be able to make a profit so that you can sell your shares after the price has hiked. The higher the level of volatility, the quicker the price is changing. This alone does not tell you if the price is getting higher or lower, just that it is moving.
Low volatility indicates a minimal price move, and high volatility shows far more significant shifts in price. High volatility also indicates that there are likely to be price inefficiencies in the market and to traders, this means they have a higher chance of turning a profit. The only volatility indicator that will be discussed in depth is Bollinger Bands.
Volume
Volume indicators show you how many units of bitcoin are being sold over time. As prices change, the volume indicator is used to predict how reliable these shifts are. If significant changes are made with high volume, the transformation is more likely to stick than a price change with low volume. We aren’t going to focus on this indicator in too much depth, but important indicators include Chaikin Money Flow, Klinger Volume Oscillator, and On-Balance-Volume.
Indicators are essential because they are tools that can be used to show what is likely to happen next on any given market, which is essentially one of the most important things to know to be successful at trading. You need to understand the future of prices to get ahead of the trend and make your money.
It’s almost impossible ever to be entirely sure of what will happen in the future. This is why, to some extent, you must prepare for every possible outcome. Understanding the different possibilities, and creating contingency plans for those that are most likely means that you will be prepared for whatever does eventually occur.
It is always important to remember the bigger picture – traders can make money in bull and bear markets. Short-term positions are easy to take advantage of, but longer-term positions can also work in your favor. It can be easy to get caught up in the direction of the market in the short term without considering a more long-term perspective. As long as the price is moving, you can make a profit with the help of indicators.
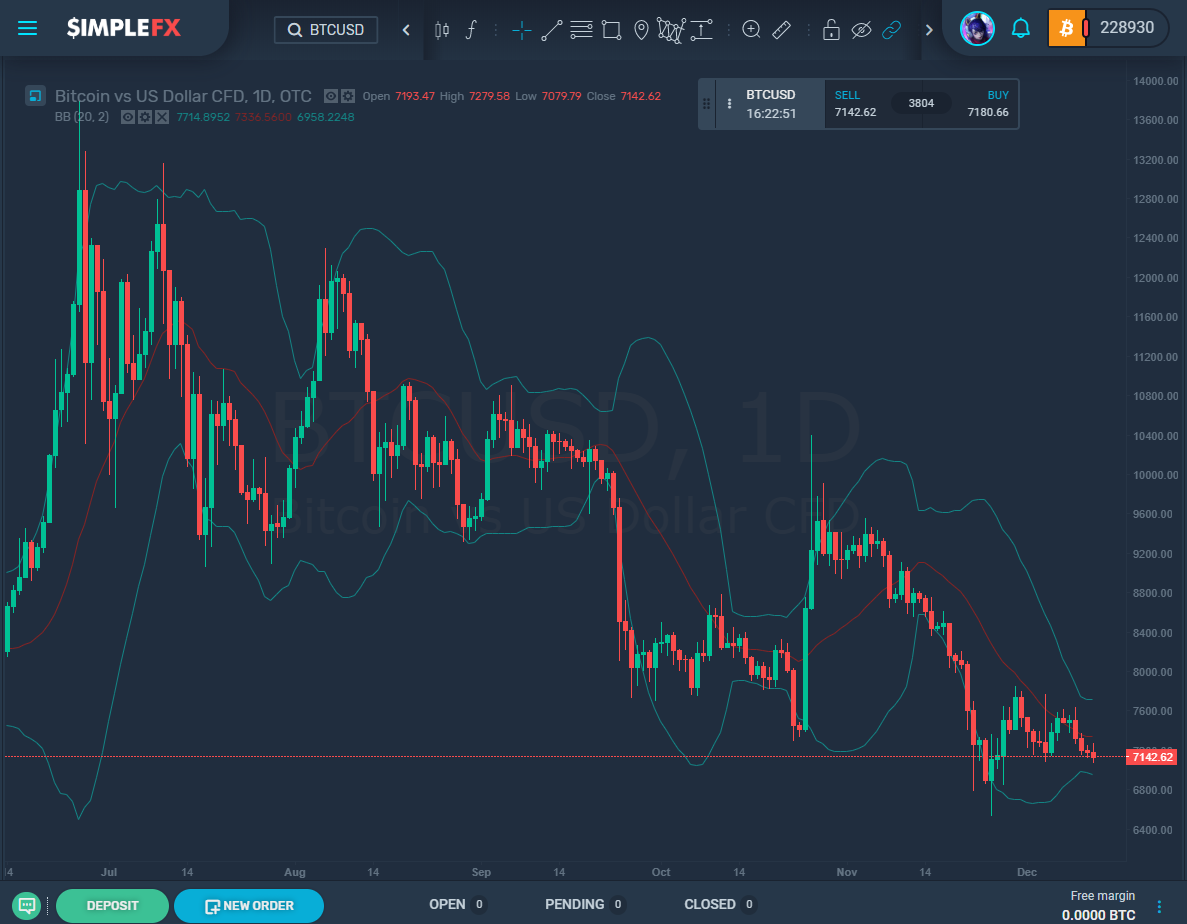
Bollinger Bands
This is a form of indicator that portrays volatility. It is two lines plotted at two standard deviations away from the central average line. These two outer lines make up the band, and these depict a moving average. When the band is narrow, it means that the market is quiet. Conversely, when it is wide, it means the market is loud. Bollinger bands can be used to trade in both ranging and trending markets.
If you are using it in a ranging market, look for the Bollinger Bounce. As the name would suggest, this is many small shifts that bounce from one side of the band to the other, but they always return to the moving average. This is essentially regression to the mean, and the price will always return to the average as time progresses.
In the case of Bollinger Bounces, the bands act as resistance levels and provide dynamic support. If the price hits the top of the band, place a sell order. Make sure that it has a stop loss just above the band, to create protection against a breakout. This should cause the band to fall back down to the average. If you’re lucky, it will push it down to the bottom band, where you can even take profits.

An example of the Bollinger Bounce is shown on the image below:

When the market is trending, you can take advantage of the Bollinger Squeeze, which enables you to time your trade entry correctly, and catch breakouts early. When the bands squeeze together and get closer, this indicates that a breakout is about to happen. This alone does not tell you which way the breakout will go, so you should be prepared for the price to rise or drop.
- If the breakout pushes candles below the bottom band, this suggests that the move will continue downwards.
- If the breakout pushes the candles above the top band, the upward trend will likely continue. This is shown in the image below.
Ichimoku Kinko Hyo (also known as Ichimoku Cloud)
Ichimoku Kinko Hyo (AKA the Ichimoku Cloud) is comprised of many lines plotted on a chart. This indicator is designed to measure the momentum of future prices, and it also helps to determine future potential areas of support and resistance. Although it looks like a complex indicator, it can be broken down into easy-to-understand parts. Here is an explanation of what each line on the graph represents:
- Kijun Sen (blue line): Also known as the standard baseline, it is calculated by taking the average from the greatest high and the greatest low from the past 26 periods.
- Tenkan Sen (red line): This is the turning line. This is found by calculating the average from the greatest high and the greatest low from the past nine periods.
- Chikou Span (green line): The Chikou Span is also commonly referred to as the lagging line. This is the closing price of the current day, plotted 26 periods behind.
- Senkou Span (red/green band): The first Senkou line is the sum of the average of the Tenkan Sen and the Kijun Sen, plotted 26 periods ahead. The second Senkou line is determined by finding the average of the highest high and the lowest low from the past 52 periods, and then plotting this 26 periods ahead.
To use this information to generate a profit, a few more things must be understood.
Just like with the Bollinger Bounce, the bands that create the Senkou span operate as dynamic support and resistance levels. When the price moves above the Senkou Span, the top line becomes the first support, and the bottom line becomes the second support.
Conversely, if the prices fall below the Senkou Span, the bottom line operates as the first resistance, and the top line becomes the second resistance.
The Kijun Sen is identified as the blue line and can be used to confirm any trends that exist. If the price breaks above the Kijun Sen, there is a high possibility that the price will continue to rise even further. And if the price drops below the Kijun Sen, then it is likely to continue to drop more.
The Tenkan Sen (red line) also allows traders to confirm trends and acts as a trend indicator. If the line moves vertically (up or down), this indicates a trending market. If the line moves horizontally (left or right), the market is ranging.
The Chikou Span (the green line) is always plotted 26 periods behind the current period, something that is very important always to remember. This can also be used as a trend indicator. When the line moves upwards to crosses the price, the price is likely to increase. If the line moves downwards and crosses the price, it is expected that the price will decrease.
This indicator works well to provide you with a lot of information, but its complex nature can be a lot to remember. As long as you know what each line represents, you will have no problems and can use it to increase your profits.
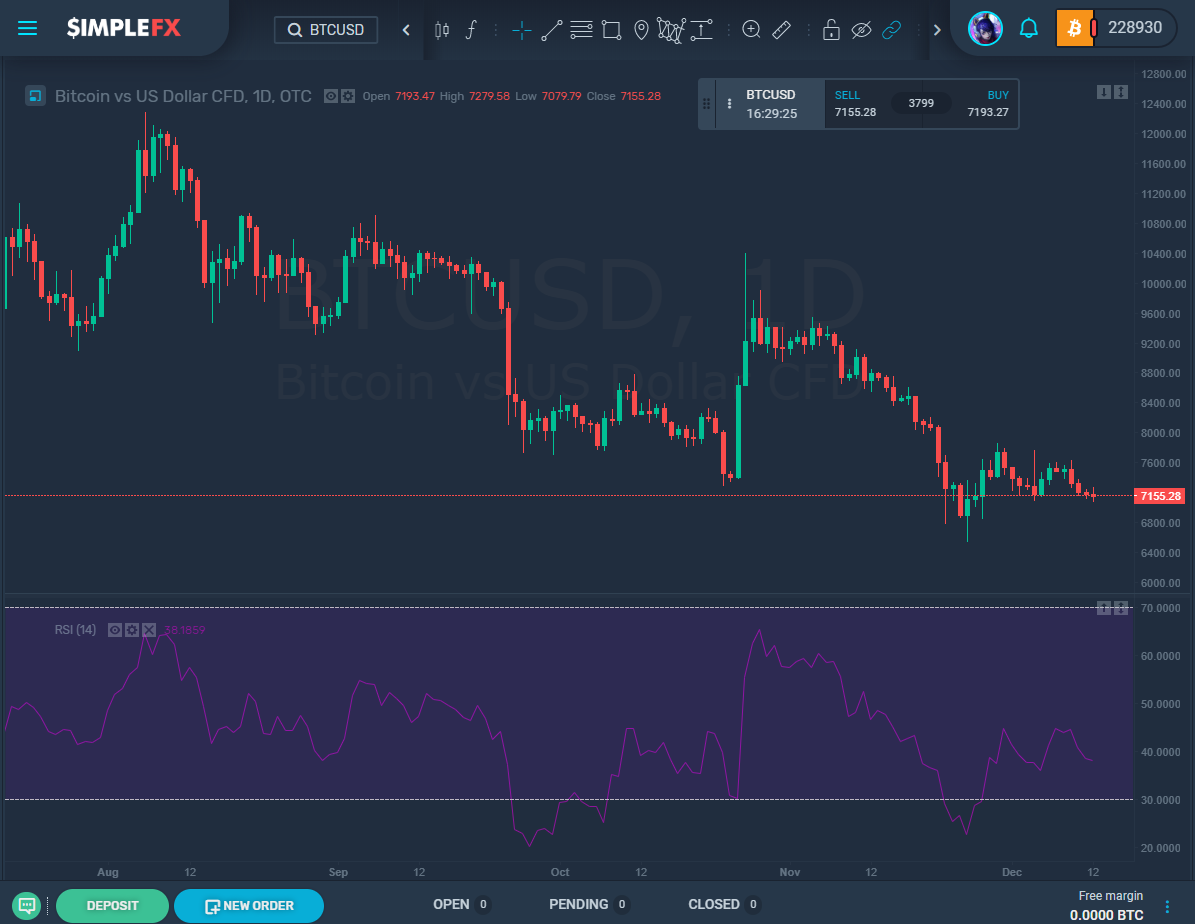
Relative Strength Index (RSI)
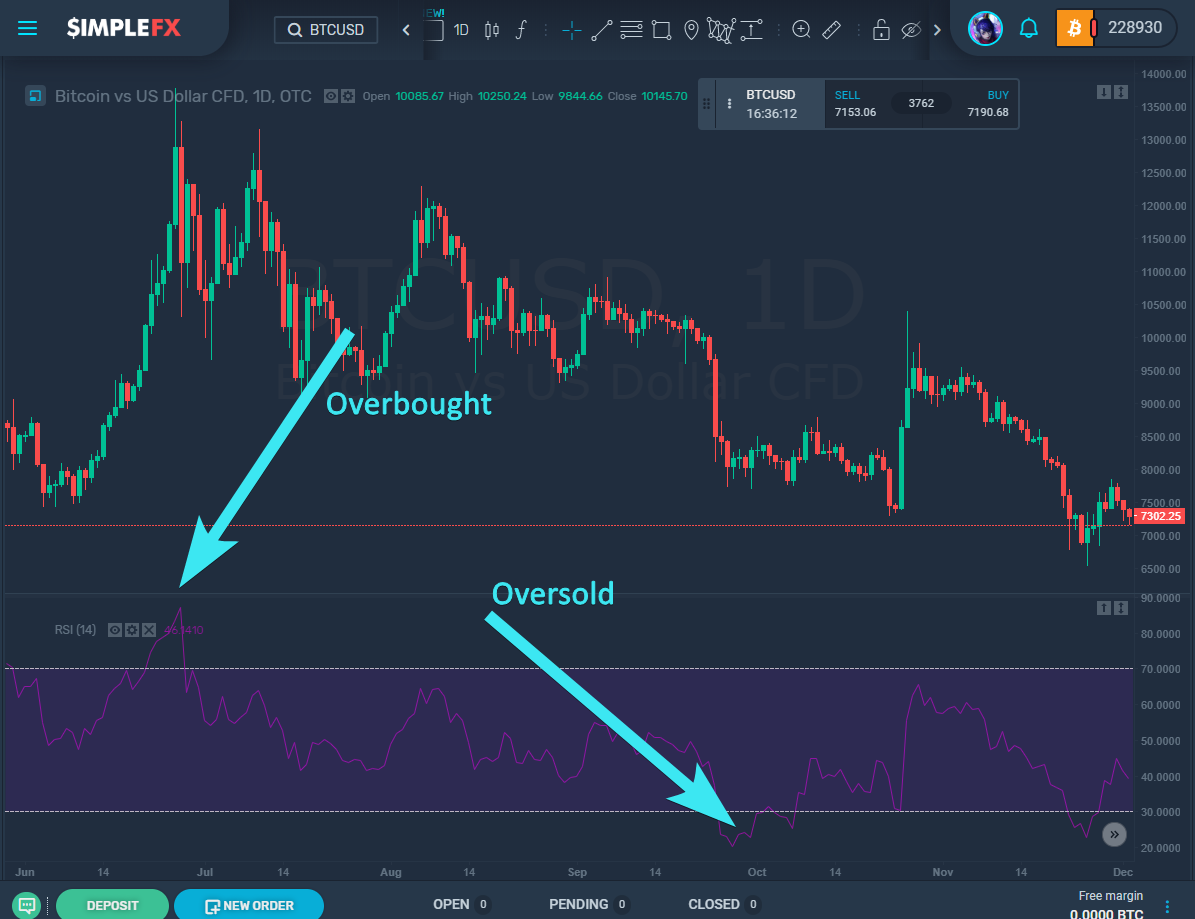
The Relative Strength Index is a momentum indicator. It is comprised of a single line that is scaled from 0 to 100 and is used to tell when the market is facing overbought or oversold conditions. If readings of the scale are over 70, this means that the market is overbought. If readings are below 30, the market is oversold. It points out all of the tops and bottoms.
The point of the RSI is not to get ahead of the trend, but actually to pick up on it just as it is reversing. This can still help you to take advantage of the whole fluctuation, and make some money. Take a look at the example below:

We can use the RSI to tell that the market had been oversold. When a market has been oversold, this is a great time to buy. We can see that later the market moves back up. So if you had the opportunity to buy into the market around February 6.
Trend patterns can be confirmed using the RSI. If the RSI rises to above 50, the market is most likely to be experiencing an upward trend. And if the RSI line is below 50, the market trend is probably going down.
Take a look at the example below. We can see that there is evidence of oversold conditions. So while it looked like an excellent investment at the time, we can also see that it turned out to be a fakeout, and the price dropped significantly not long after.

If you go back and take another look at the first graph that depicts a trend as shown through RSI, you can see that in that case, the RSI did manage to break through past the level 50 mark. It lingered around that value for around a week, but it did manage it.
So if your strategy is to avoid unnecessary risks where possible, you might want to wait for the actual trend confirmation before you take action to avoid fakeouts. Although you will gain a higher profit the earlier, you get in there, and you also run the risk of being wrong and losing out on a lot of pips. But if you wait to complete trend confirmation, you’ve already missed part of the move and will receive a smaller profit, even though you made the right choice in the end.
It just depends on your investing style and how many risks you want to take. Some people don’t mind taking significant risks if it means that the reward is big, while others would instead stack up lots of smaller wins, with lower risks. There are pros and cons to both methods, and it’s up to you to decide how you want to operate.
Moving Average Convergence Divergence (MACD)
Another popular indicator that can provide you with a lot of helpful information is MACD. This one involves a fast line, a slow line, and a histogram. These are created by using a faster-moving average (also known as the MA-fast), a slower-moving average (the MA-slow), and a number which is used to define the period for another moving average (MA-period).
- The MACD fast line is a representation of the moving average of the difference between MA-fast and MA-slow.
- The MACD slow line depicts the moving average of the MACD fast line. The MA-period is used to determine the number of periods.
- The histogram is a visual representation of the differences between the fast and slow lines.
The information can seem a little confusing at first, but the MACD can be a handy indicator, so it is worth taking the time to understand it and all of its uses entirely. Here is an example. We’ll start with MACD “12,26,9” because this is a typical default setting. This information shows that the fast line is the moving average of the difference between the 12- and 26-period moving averages. The slow line is a 9-period moving average of the MACD fast line. The histogram displays the differences between these two lines.
You can also see that on the chart, there is convergence and divergence. This is created by the two moving averages and the histogram – the lines cross each other now and then, and this measures how close they are.
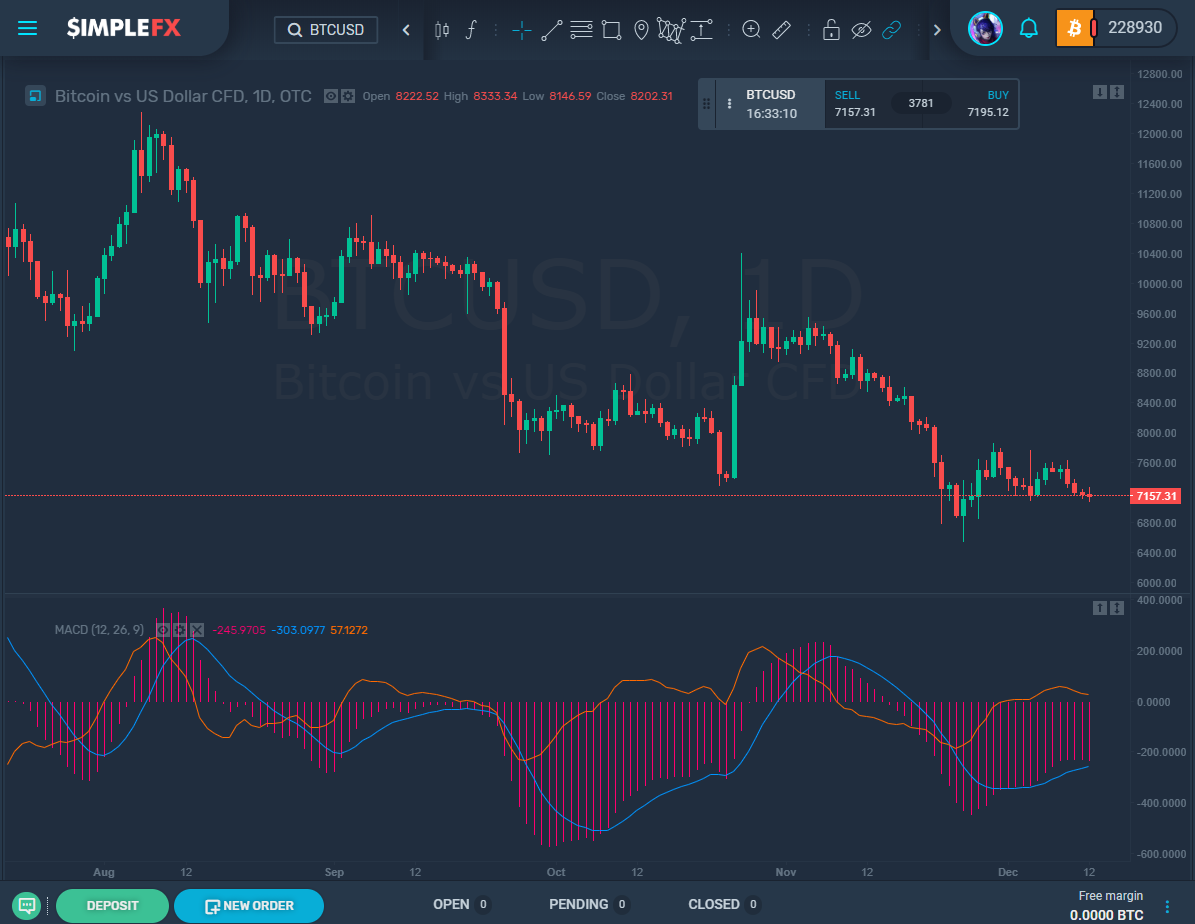
The lines converge when they move together, and the distance between them gets smaller. And when they move apart, and the distance between them grows, this is divergence. This specific factor of the indicator is what can be used to improve your trading.
The convergence of MACD lines indicates that a new trend is forming. When the lines crossover, this signals that the trend has reversed, and the lines will start to diverge. At the point of the crossover, the difference between the lines is 0, and this causes the histogram to disappear.
As you can see from this next chart, the fast line (blue) has crossed over the slow line (orange) on February 19. The previous downward trend has ended, and it signals the start of a new upwards trend. You can see that there is indeed an upward trend for the next few days after that. It results in a $2,000 profit per BTC, and a move for almost 200,000 pip.
An important thing to remember is that while MACD is useful at confirming trends, it is not necessarily the greatest at predicting them early. MACD is comprised of the moving averages of other moving averages. As a result of this, it can often lag behind the current price, compared to other methods. These indicators all have their strengths, but it doesn’t mean they don’t have their weaknesses too.
Parabolic Stop and Reverse (SAR)
This is an indicator that is slightly more easy to understand and is used to predict trends. This indicator is comprised of dots that are placed either above or below the price on the chart, allowing you to know the potential direction of the price movement.
When the dots are above the price, this means that the market is in a downward trend, and you should be short. Alternatively, if the dots are below the trend, it means the market is moving on in an uptrend, and you should take a long position.
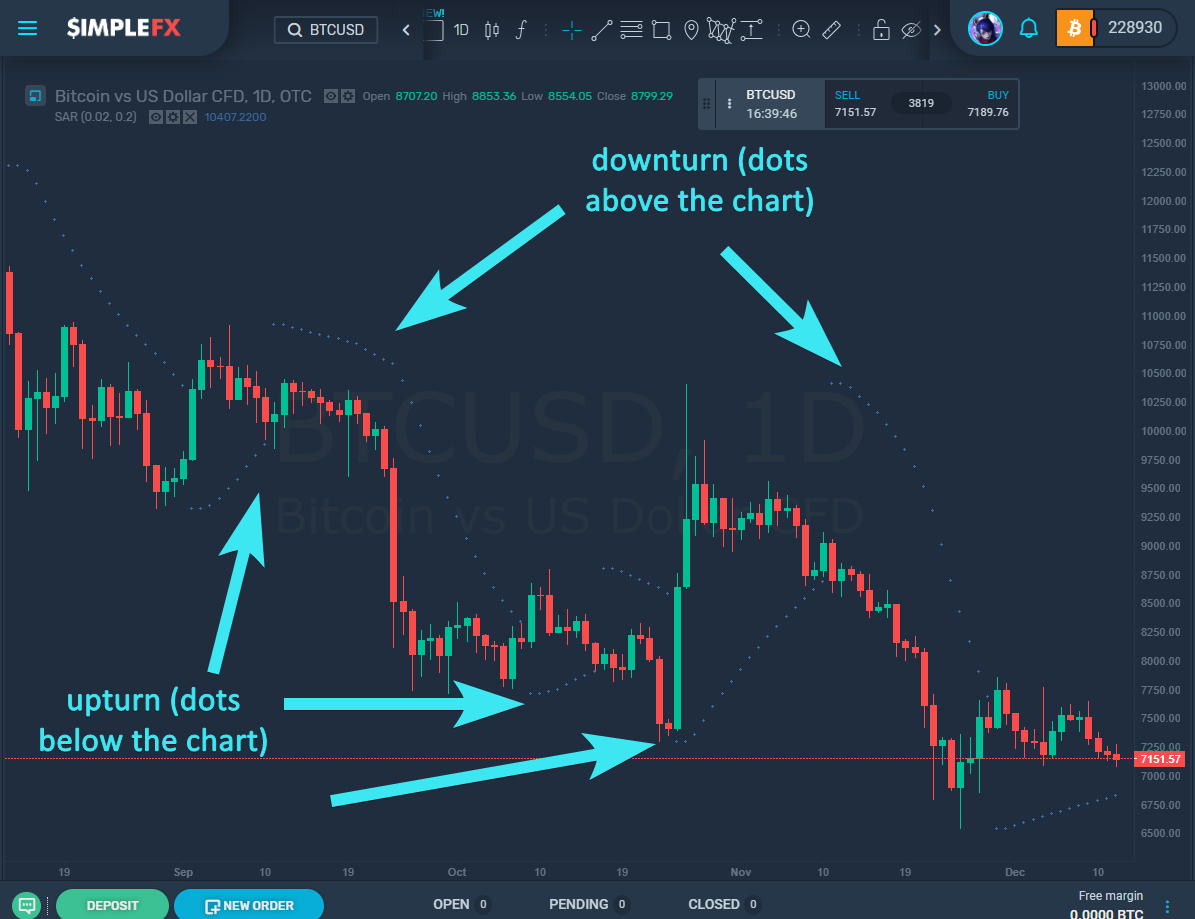
While this is a great indicator to get to know trends, it too has its’ shortcomings. This indicator cannot be used to get a decent result in ranging markets if the price is moving sideways. This will only generate a lot of noise, and the dots will shift up and down, and you won’t receive a clear signal.
Stochastic
The stochastic indicator is a momentum indicator and helps to discern when a trend might end. And just like RSI, it can be used to tell if an asset has been overbought or oversold. This indicator is two lines plotted on separate charts.
This indicator can help you jump on a trend as soon as it begins by helping you pick an entry point. When the stochastic lines rise above 80, it means that the market has been overbought, and there is likely to be a downtrend very soon.
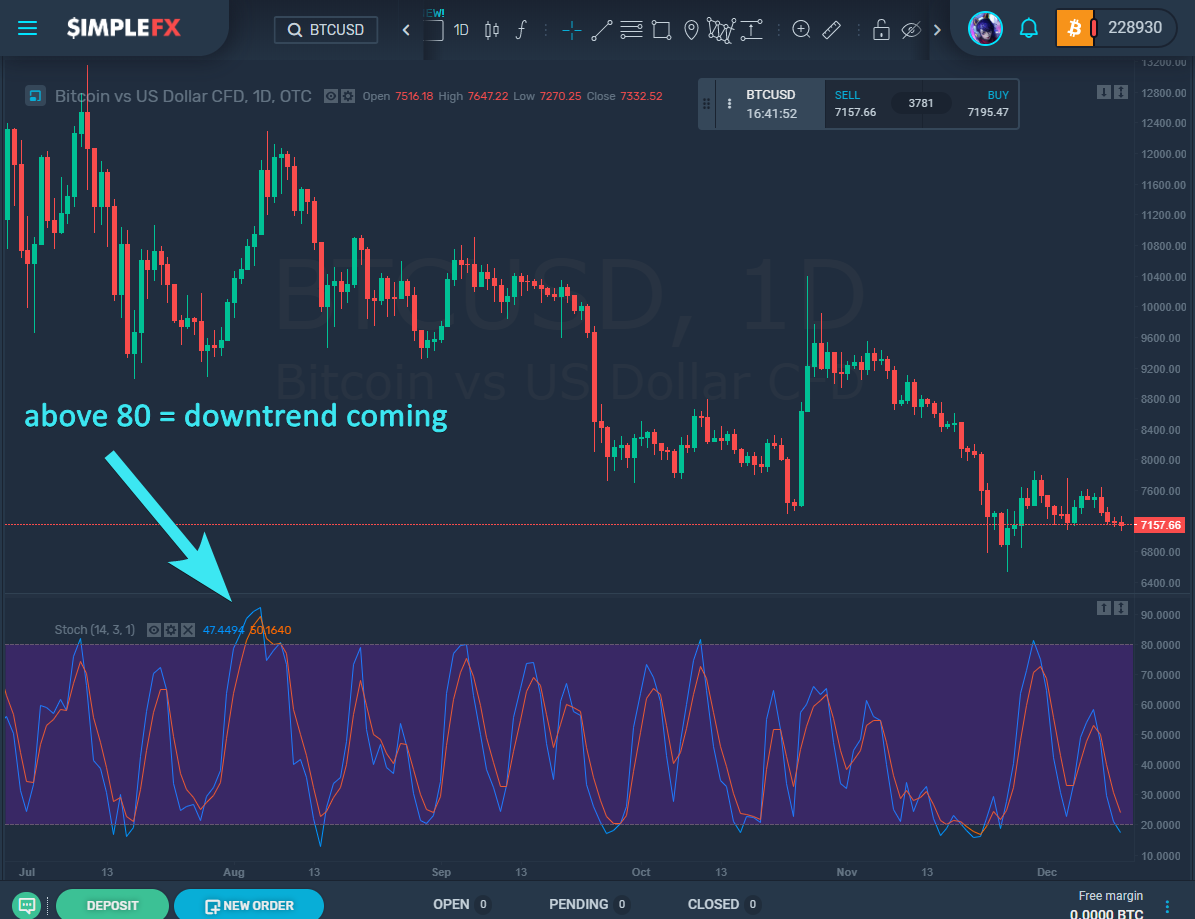
Conversely, when the stochastic lines fall below 20, it means that the market is oversold, and an uptrend will most likely follow.
And just like RSI, you may experience fakeouts with this indicator. A rise in levels above 80 does not 100% guarantee a downtrend, and a fall below 20 does not automatically result in an uptrend every time, these are only just predictors. Use the indicator to give you a decent idea, but also weigh your risks, to make smart choices.
Average Directional Index (ADX)
The ADX is used to indicate trends, and it is an oscillator. The ADX has a value range of 0 to 100, which highlights the strength of a signal.
A weak trend is indicated by an ADX value of less than 20. A strong trend will show an ADX value of 50 or higher. Although you get to know the strength of the trend, you do not see what direction it is heading.
One of the great features of ADX is that it does not offer you fakeouts. Unfortunately, it doesn’t provide any indication of trend direction, so it is best used in conjunction with another trend indicator that does fulfill this purpose.
If you also utilize a directional trend indicator as well as ADX, you can be confident in the strength of the trend, as well as which way it is going. This will give you the confidence you need to enter a position.
ADX can also tell you when to leave the trade when the trend weakens, allowing you to avoid getting caught out by price retracements.
While ADX is useful for trading strong trends, it does lag slightly. Therefore, this is not the indicator for you if you are trying to get in on trends as early as possible.
But those are the seven most popular indicators that you might find, and all of their pros and cons. It is a great idea to check out all of them so that you get a feel for what you like and what works best for you. And remember, you can always change the default parameters for indicators. They might not be the best for cryptocurrency or your style of changing, so don’t be afraid to change them to get something that works for you. Figure out the way to get the best signal for you, or how to catch the best trends and get better entries. Everyone has a different trading style that works for them, and the indicators can be manipulated to suit all of these.
Trading while using more than one indicator
Although it may already be apparent, each indicator has its faults, and using just one will never net you a substantial profit. None of them will ever be accurate all of the time, and they can fail to provide crucial information. But a solution to this is to use complementing indicators together, to fill these gaps, create better signals, and overall improve your trading. Here are some examples of indicator combinations you might find useful:
Parabolic SAR & Ichimoku Cloud
Here you can see the Parabolic SAR and Ichimoku Cloud together on the BTCUSD 1D chart. If you were using the Ichimoku Cloud alone, you might enter the trade on Day 1, because the price is below the Kijun Sen (blue line), indicating the start of a downward trend. But because you are using both indicators, it is wiser to hold on.
One Day 2, the price did recover slightly, but it is still below the Kijun Sen, always keeping it bearish. But the Parabolic SAR is below the candlestick, which indicates a bullish signal, conflicting with the Ichimoku cloud. Because of this lack of corresponding information, it is best to wait.
Then on Day 3, the price drops significantly. It is still under the Kijun Sen, but now the Parabolic SAR has flipped, and the dots are above the price. Both indicators now show bearish signals, suggesting that now is a great time to enter the market and go short.
If you enter the market here, you have favorable conditions for the next 26 days. If you had sold $14,000 on day 3, you could have received over 800,000 pips, equating to $8,000 per BTC.
On the graph, we can also see some fakeouts around January 20 and 28, where the price is closing about the Kijun Sen. If you had been using the Ichimoku Cloud, you might have closed out your position on one of these two days. But at those same times, the Parabolic SAR was still bearish and would have given you critical information that would indicate where the price was going.
RSI & Bollinger Bands
It’s also potentially a good idea to use RSI and Bollinger Bands together. Combined, these indicators can show you when the market is turning, and when to pick an excellent entry point.
We can see from the RSI graph that the market was overbought at the end of October 2017. You might have sold here, but if you’d also consulted the Bollinger Bands, you’d have known that they were still expanding, and this would not have been a wise choice. 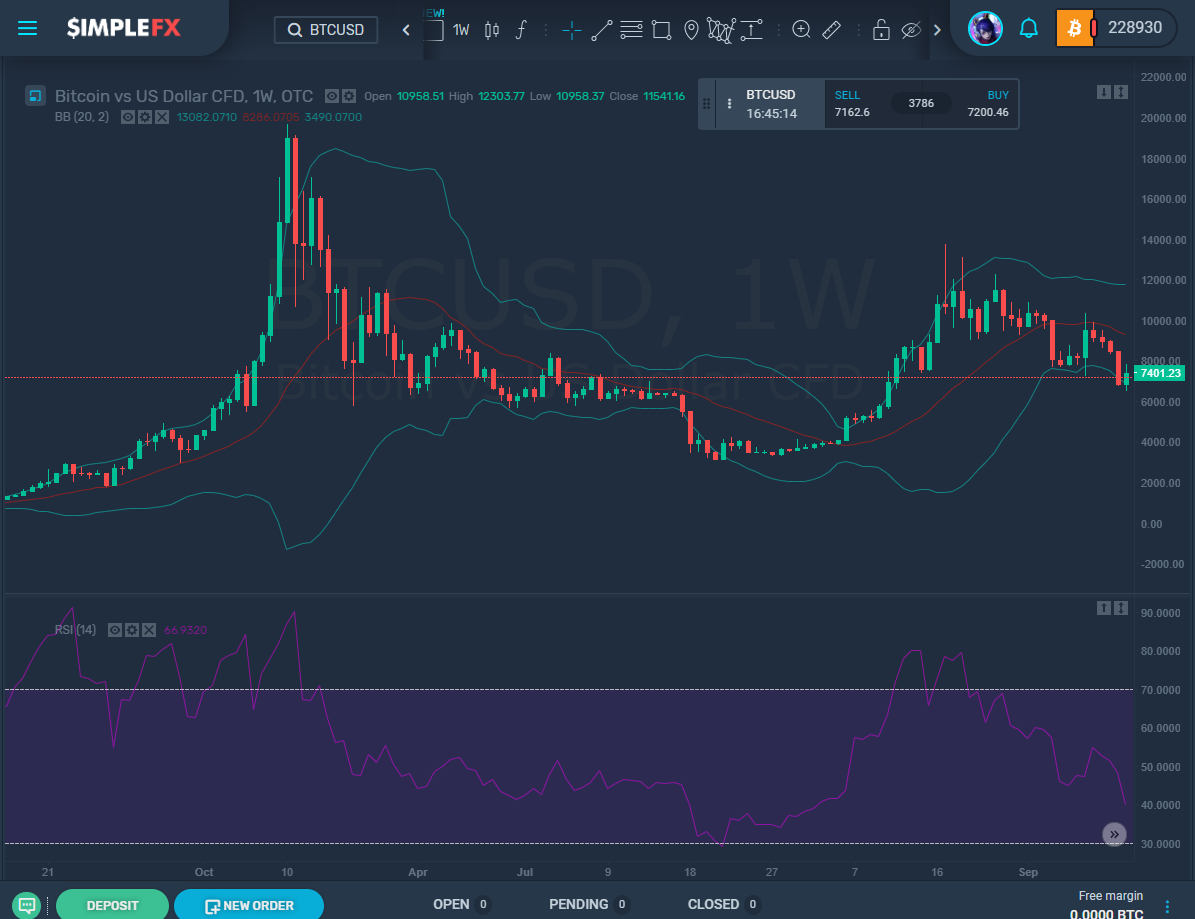
Even into the beginning of November, RSI continued to show these overbought conditions, and the market continued to rise. If you had repurchased in October, you’d be having severe reconsiderations at this point. But if you also look at the Bollinger Bands, those are starting to contract, indicating an increasingly quiet market.
The Bollinger Bands squeeze together, and the RSI indicator shows an overbought market. That would be the perfect time to sell, and both indicators are in agreement. If you’d sold at this point, you could have received 200,000 pips over the next week, equating to $2,000 per BTC.
So as you can tell, indicators can be great tools. They can be used to understand when to enter the trade, market direction, and generally give you a sense of confidence in your trading. And for the best results, indicators should be used together, to allow you to disregard fakeouts, and help you to make more money. Nothing is ever perfect, but this certainly helps.
Mix and match indicators until you find a combination that works right for you. Everyone has their style, and once you find yours, you’ll be on your way to making that money.


