


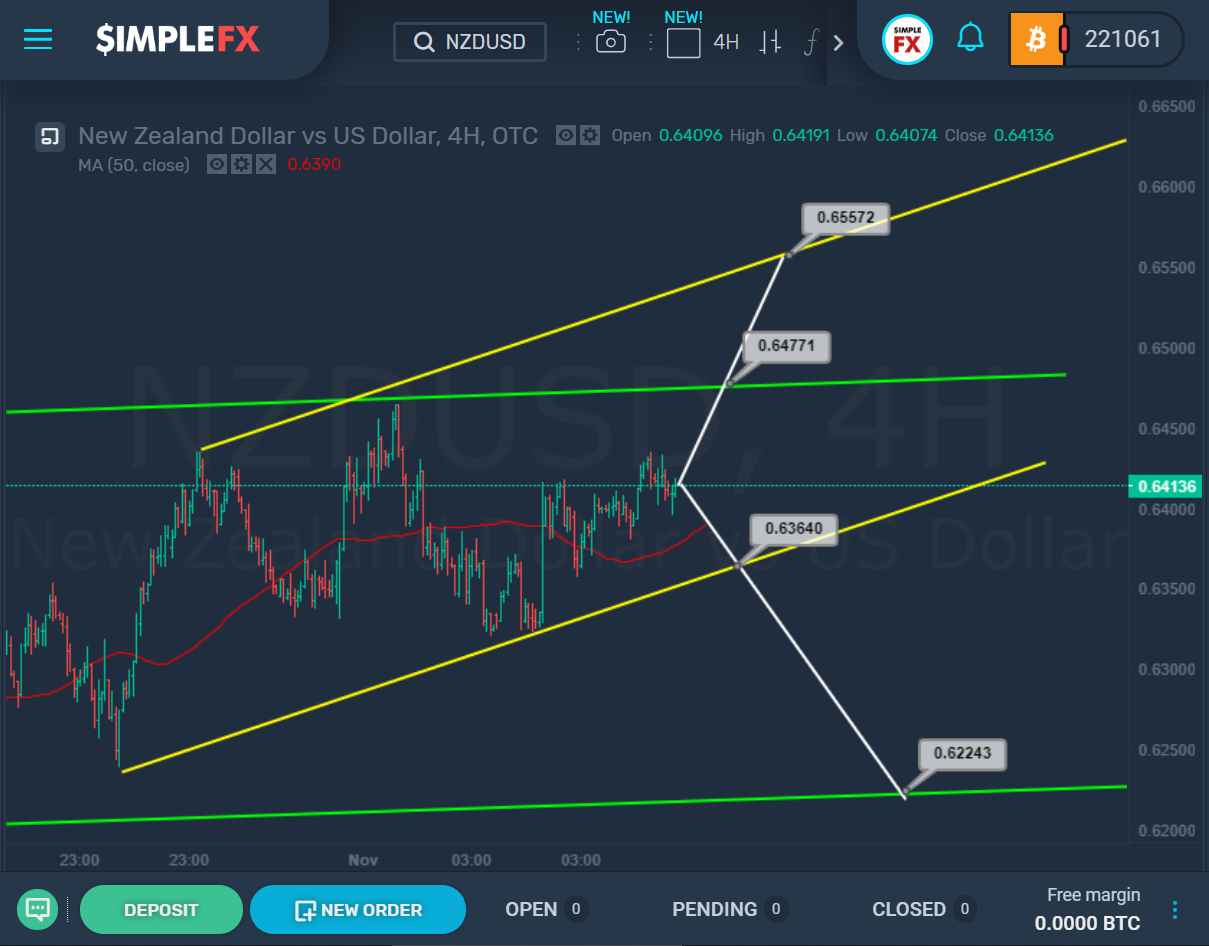

If we see a break of the lower wall of the yellow channel and the support level of 0.636, the decline may continue to the level of the lower green bound and the support level of 0.622.
However, if the market is dominated by bulls, we may see an upward movement and a break of the upper green wall near resistance of 0.647. Then the bulls will open the way to the next resistance, which is at the level of 0.655. Chart provides a schematic view of two options of the market movement.


