
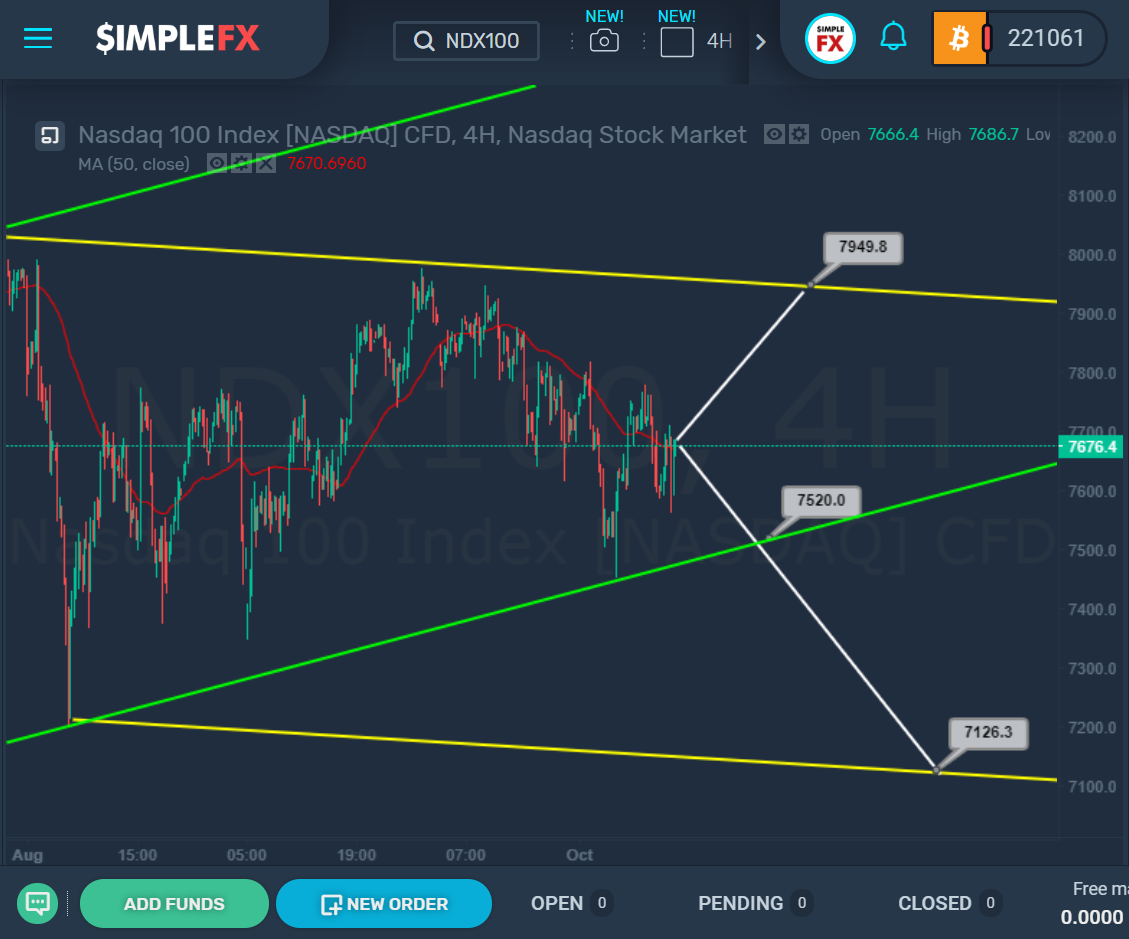
At the moment, the price movement can be described by the yellow descending and green ascending channels. We see that the market alternately pushes away from these bounds, gradually squeezing between the green and yellow lines. However, now it is difficult to say whether we see a downtrend from the upper bound of the yellow channel to its lower wall, or the price, starting from the green bound, moves up to the yellow resistance line.
If the market follows an upward scenario, we will see an increase in the resistance level of 7949. If the bears are stronger than the bulls, the market will move down to the support level of 7520. In case of a break down of this level, the decline will continue to the support level of 7126, which is located on the lower bound of the yellow channel. At the moment, the probability of implementing these scenarios is about the same.


