
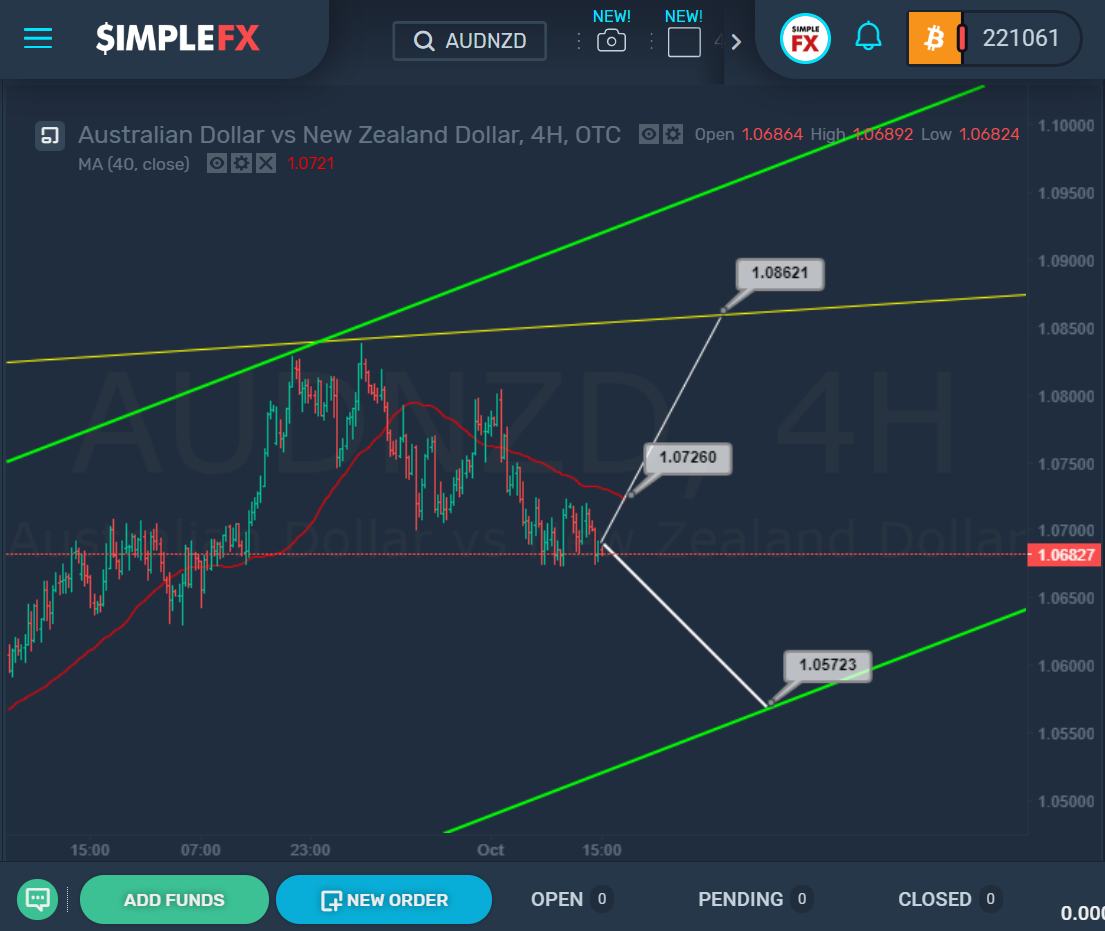
 After the price reached the upper green and yellow bounds of the channels, we saw a gradual downward movement of the market in the direction of its lower wall. Most likely, at the moment the bears are gradually pushing the price in a downward direction to the support level of 1.057. This scenario is supported by the fact that the price went below the moving average line. If we see a breakdown of the resistance level of 1.072 up, which is formed by the red moving average, the price growth will continue to the level of 1.086, which is located on the upper bound of the yellow channel.After the price reached the upper green and yellow bounds of the channels, we saw a gradual downward movement of the market in the direction of its lower wall. Most likely, at the moment the bears are gradually pushing the price in a downward direction to the support level of 1.057. This scenario is supported by the fact that the price went below the moving average line. If we see a breakdown of the resistance level of 1.072 up, which is formed by the red moving average, the price growth will continue to the level of 1.086, which is located on the upper bound of the yellow channel.