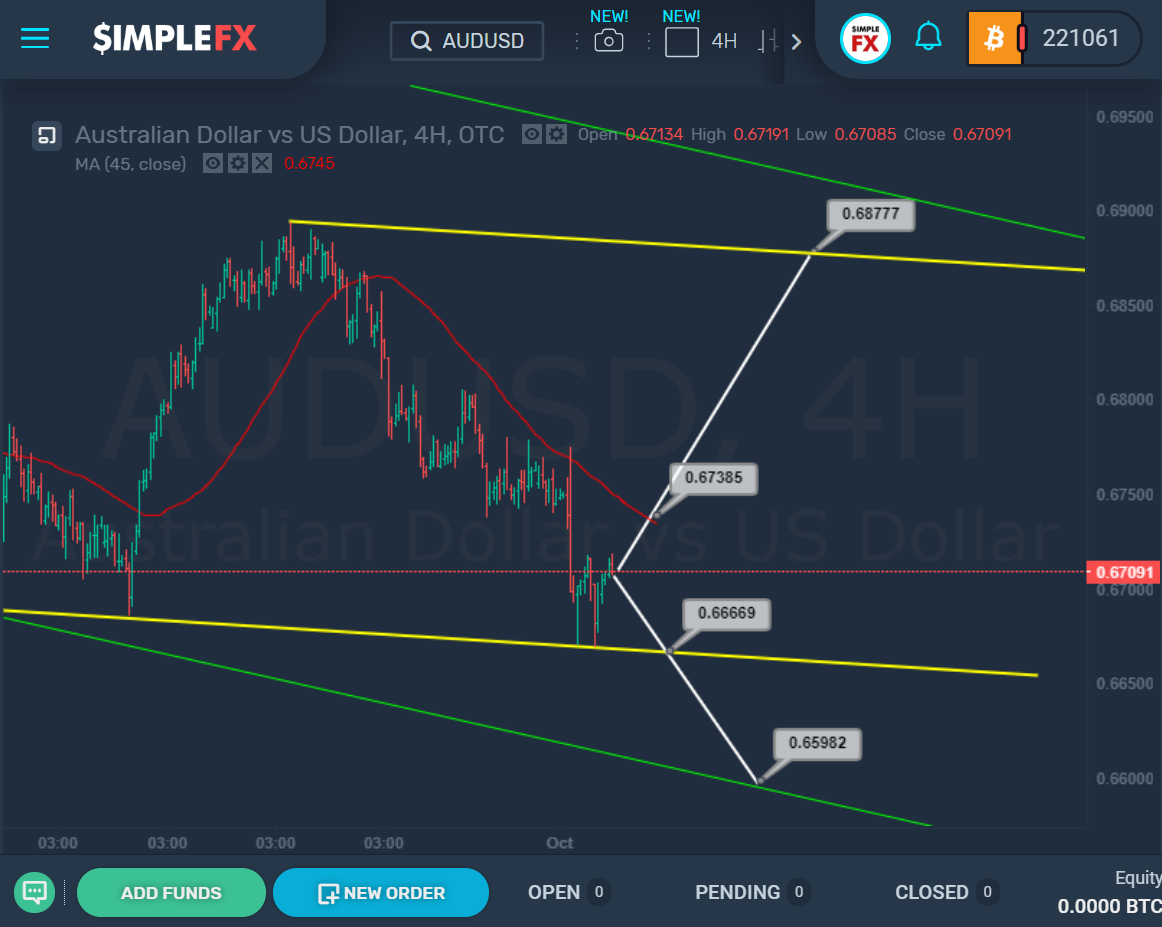
 During the previous trading week, we saw a downtrend from the upper bound of the yellow channel to its lower wall. Then the price rebounded from the lower yellow bound. In the near future, there are two options for price movement. According to the first option, we will see the market grow from the lower bound of the yellow channel to its upper wall to the resistance level of 0.687. Events will develop according to this option if the resistance of 0.674 formed by the moving average is broken. If we see a continued decline and a breakdown of support of 0.666 located on the lower yellow wall, the market may continue to decline to the level of 0.659, which is located on the lower wall of the green channel.
 During the previous trading week, we saw a downtrend from the upper bound of the yellow channel to its lower wall. Then the price rebounded from the lower yellow bound. In the near future, there are two options for price movement. According to the first option, we will see the market grow from the lower bound of the yellow channel to its upper wall to the resistance level of 0.687. Events will develop according to this option if the resistance of 0.674 formed by the moving average is broken. If we see a continued decline and a breakdown of support of 0.666 located on the lower yellow wall, the market may continue to decline to the level of 0.659, which is located on the lower wall of the green channel.