Close Menu
SimpleFX BlogSimpleFX Blog
    Facebook X (Twitter) Instagram
    Friday, May 16
    Facebook X (Twitter) LinkedIn Telegram YouTube
    SimpleFX BlogSimpleFX Blog
    Banner
    • Home
    • News
    • Tutorials
    • Updates
    • Opinion
    • Trading Academy
    • Trading Schedule
    SimpleFX BlogSimpleFX Blog
    Home » SimpleFX SPX500 Chart Analysis: September 17
    Analysis

    SimpleFX SPX500 Chart Analysis: September 17

    Zach WrightBy Zach WrightSeptember 17, 2019No Comments1 Min Read
    Facebook Twitter Pinterest LinkedIn Tumblr Email Telegram Copy Link

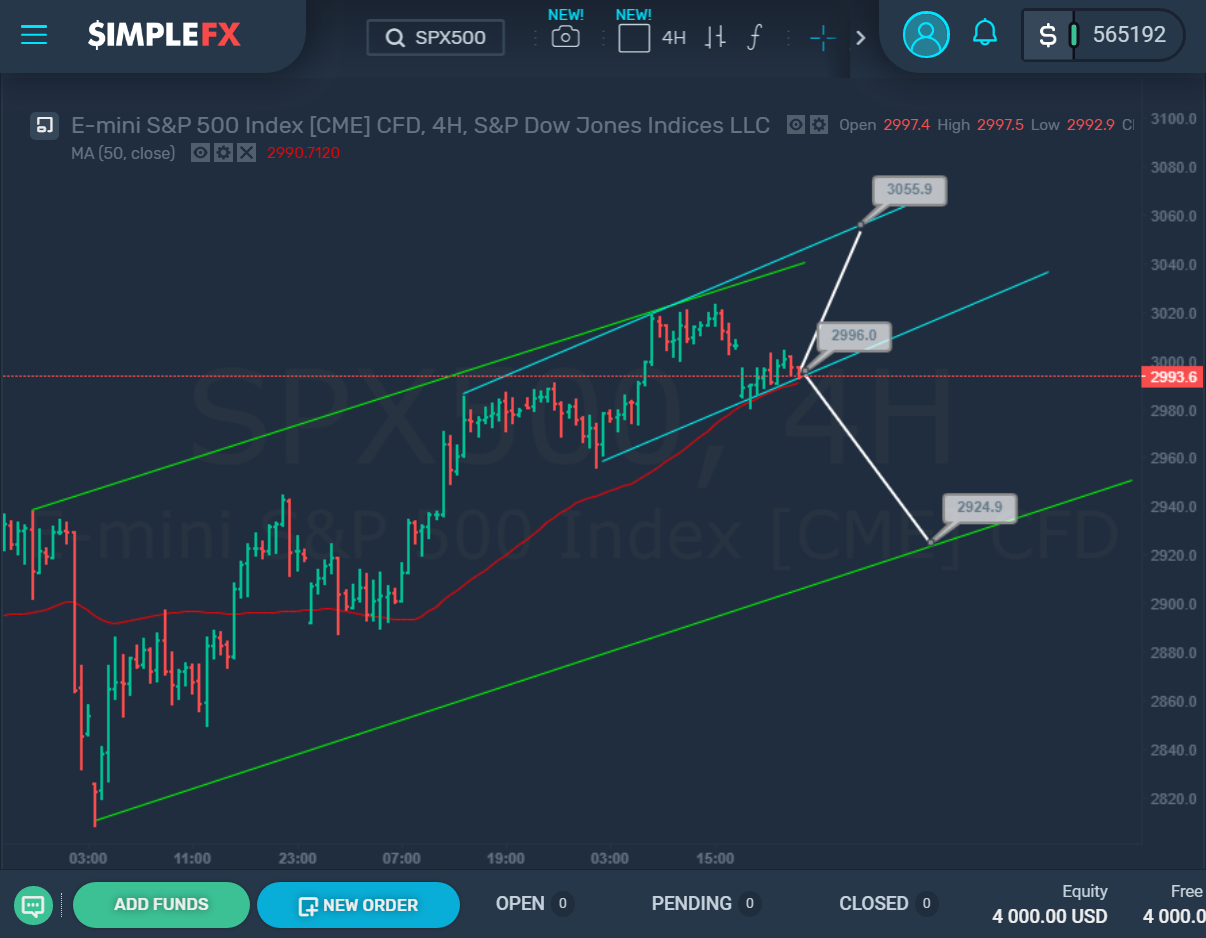
    The price continues to move by the lower limit of the blue channel, periodically reaching it. This limit is the support line for the price. If the price strikes through the support of 2996, the bears will have an opportunity to start moving to the lower limit of the green channel and the level of 2924. It should be noted that in this case, the movement is likely to occur in a corrective form, as the market will move against the direction of the up-tending green channel. If the price drafts off the lower blue limit and the support level of 2996, the growth will possibly continue to the upper limit of the blue channel and the resistance level of 3055.

    stocks
    Share. Facebook Twitter Pinterest LinkedIn Tumblr Email Telegram Copy Link
    Previous ArticleSimpleFX XAUUSD Chart Analysis: September 17
    Next Article JPMorgan gold and silver traders charged for manipulating prices
    Zach Wright

    Related Posts

    Strategic Bitcoin Reserve. It’s happening

    March 7, 2025

    Market falls, Trump, U.S. foreign policy – what’s going on?

    March 5, 2025

    BTC: Bearish signal not seen in a year

    February 7, 2025
    Leave Us a Review
    Review us on
    App Store
    Google Play
    Copyright © 2014 - 2025. 8Tech SVG Ltd (formerly SimpleFX Ltd)
    • SimpleFX WebTrader
    • Unilink Affiliate Tracker

    Type above and press Enter to search. Press Esc to cancel.