


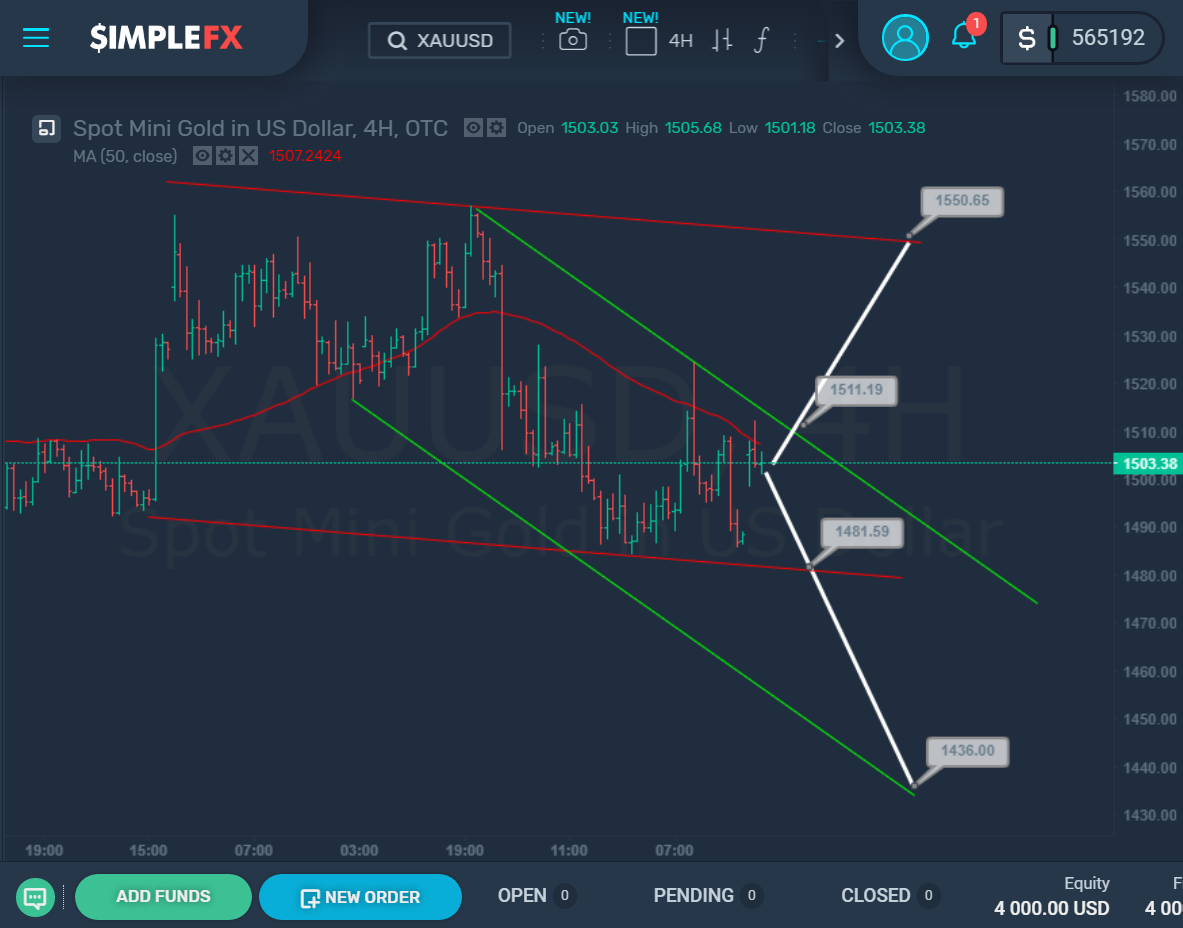

The market continues to move within the green and red channels. Now the price chart is sandwiched between the support and resistance lines. The resistance line is the upper limit of the green channel, and the support line is the lower limit of the red channel.
The red moving average provides additional resistance. If soon the market drafts off the moving average and slides down to the support level of 1481.59, the bears will open the way to the level of 1436 on the lower limit of the green channel.
If the price rises above the moving average, and then falls beyond the upper limit of the green channel at the level of 1511, the bulls will get access in the direction to the level of 1550, located on the upper limit of the red channel.


